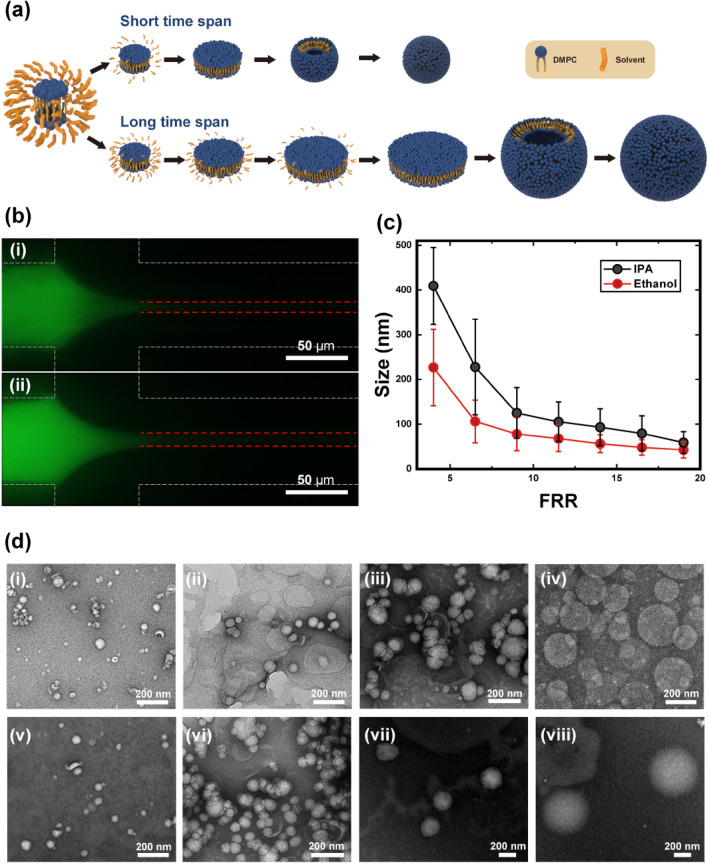
Figure 1.
(a) Vesiculation of the bilayer domain according to the time span for self-assembly. Upper side represents a short time span case (corresponding to fast depletion of the solvent); lower side shows slow vesiculation over a longer time span. (b) Fluorescence image of a focused stream according to the solvent (total flow rate = 2000, flow rate ratio (FRR) = 9, (i) Ethanol, (ii) isopropyl alcohol (IPA), Scale bar = 50 µm). (c) Size of the liposome depending on the FRR for two different solvents. Red and black circles represent ethanol and IPA, respectively. (d) TEM images of the liposomes prepared using ethanol and IPA at (i, v) FRR = 19, (ii, vi) FRR = 11.5, (iii, vii) FRR = 6.5, and (iv, viii) FRR = 4 (Scale bar = 200 nm).

