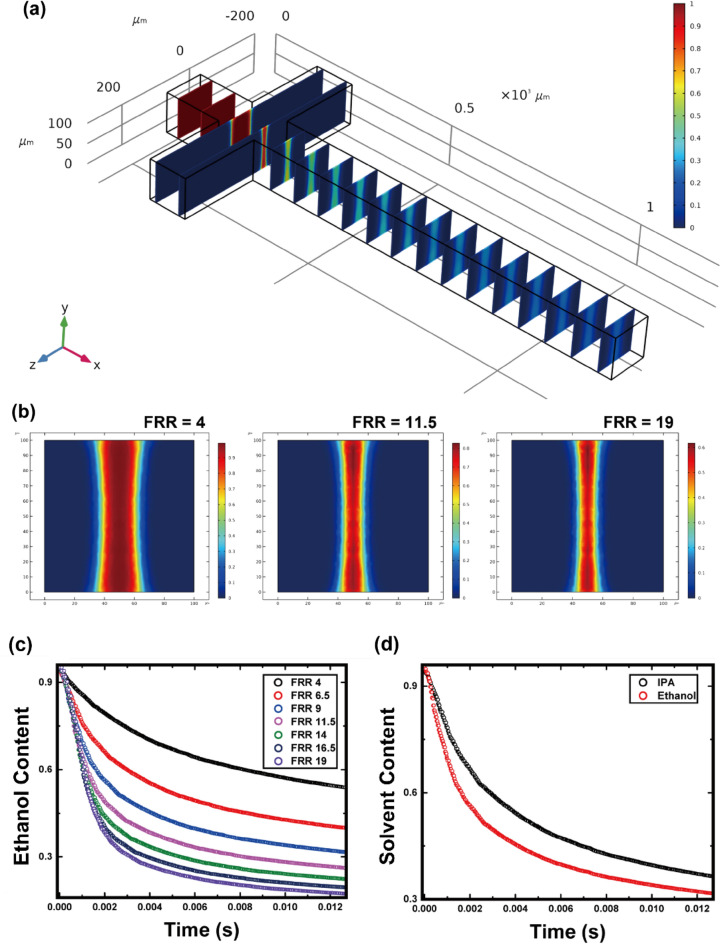
Figure 2.
(a) Three-dimensional numerical simulation result for ethanol concentration at steady state. (b) Ethanol concentration at the yz-plane. Cut plane is placed at x = 250 µm, where the cross-junction end and long diffusive mixing section starts. Lagrangian content of the solvent over time is shown plotted in relation to the (c) flow rate ratio (FRR) and (d) solvent type. Whole data were processed by MATLAB R2019B (MathWorks, Inc., Natick, MA, USA) using Eqs. (3) and (4).

