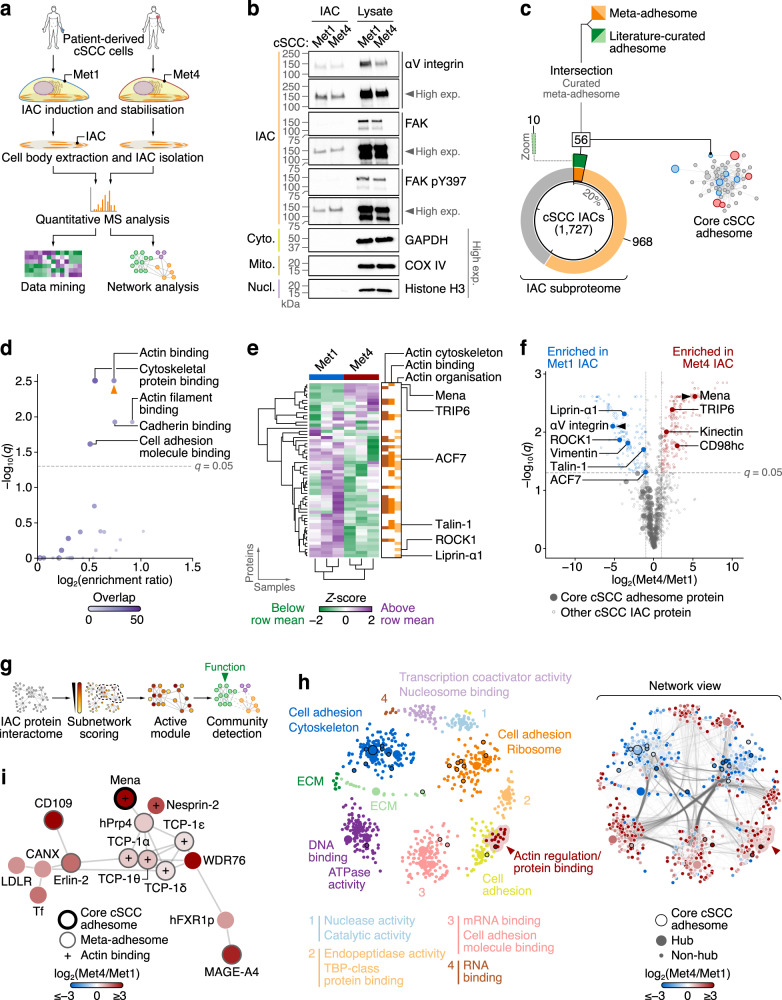
Fig. 1. Characterisation of a patient-derived cSCC adhesome.
a Workflow for isolation and proteomic analysis of IACs. b Enrichment of focal adhesion proteins in cSCC IACs compared to cytoplasmic (cyto.), mitochondrial (mito.) and nuclear (nucl.) non-adhesion proteins as determined by western blotting. Images are representative of three independent experiments. Exp., exposure. c Proportion of the 1727 IAC proteins identified by proteomics annotated in the meta-adhesome (orange segments) or the literature-curated adhesome (green segments). IAC proteins in both the meta-adhesome and the literature-curated adhesome (intersection set; 56 proteins; dark segments) represent a core cSCC adhesome (see Supplementary Fig. 1c for corresponding network). Inset segment (dotted box) shows zoom of literature-curated adhesome-only segment for clarity. d Gene Ontology over-representation analysis of molecular functions in the core cSCC adhesome. Orange arrowhead, representative functional category determined using affinity propagation. e Hierarchical cluster analysis of the core cSCC adhesome. Proteins associated with actin components (actin cytoskeleton), functions (actin binding) or processes (actin organisation) are indicated (orange bars). Actin-associated proteins significantly differentially abundant between Met1 and Met4 IACs are labelled (q < 0.05, two-sided t-test with Benjamini–Hochberg correction; n = 3 independent biological replicates). f Volcano plot of cSCC IAC proteins. Core adhesome proteins significantly differentially abundant between Met1 and Met4 IACs and enriched by at least two-fold are labelled; the most enriched in Met1 and Met4 IACs, respectively, are indicated with black arrowheads. g Workflow for graph-based analysis of the cSCC IAC subproteome. h Maximal-scoring active module of the cSCC IAC protein interactome. The network was partitioned using the Louvain modularity maximisation method. Proteins (nodes) are coloured according to assigned cluster (left panel). Network view (right panel) shows corresponding protein interactions (edge densities) in the partitioned network; nodes are coloured according to protein enrichment in Met1 or Met4 IACs. Black node borders indicate core adhesome proteins. The actin regulation cluster detailed in (i) is indicated with a red arrowhead. i Subnetwork analysis of the actin regulation cluster identified by active module partitioning in (h). Artwork in (a) was adapted from Byron, A., Griffith, B.G.C., Herrero, A. et al. Characterisation of a nucleo-adhesome. Nat Commun 13, 3053 (2022). 10.1038/s41467-022-30556-5.

