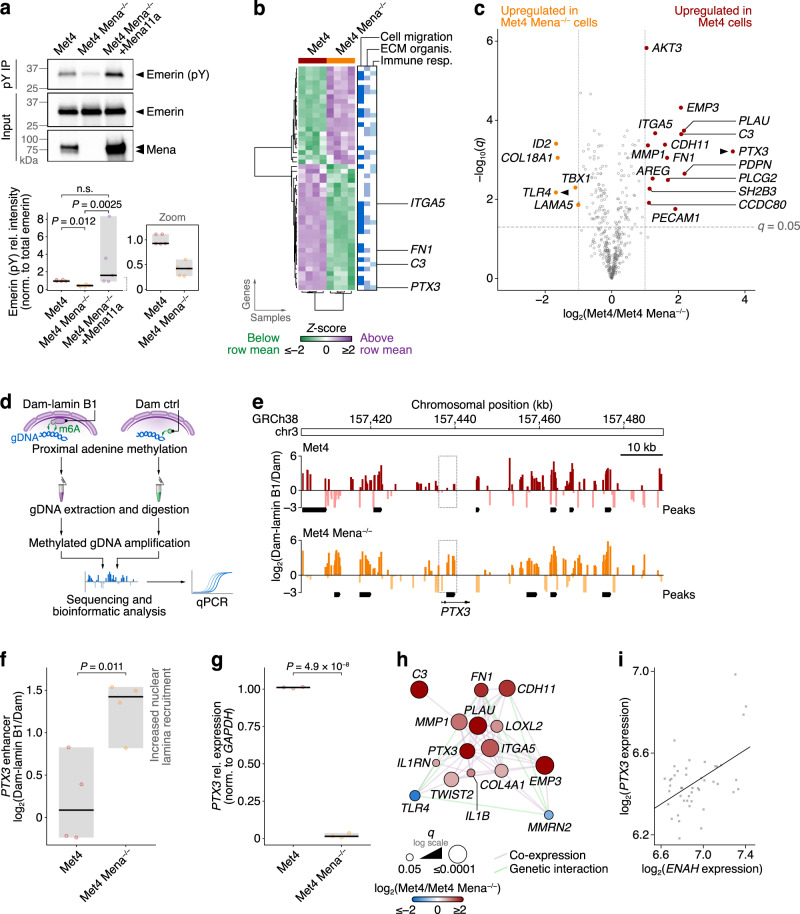
Fig. 4. Mena loss suppresses emerin phosphorylation and regulates PTX3 expression.
a Emerin tyrosine phosphorylation in Met4, Met4 Mena−/− and Met4 Mena−/− +Mena11a cells detected by phosphotyrosine (pY) IP and western blotting for emerin. Normalised densitometric intensities were expressed relative to Met4 cells (bottom panel). Black bar, median; light grey box, range. Inset (bottom-right panel) shows zoom of Met4 and Met4 Mena−/− cell quantification for clarity. Statistical analysis, Kruskal–Wallis test with two-stage Benjamini–Krieger–Yekutieli correction (n = 5 independent experiments). b Hierarchical cluster analysis of cancer progression genes significantly differentially regulated between Met4 and Met4 Mena−/− cells (q < 0.05, two-sided t-test with Benjamini–Hochberg correction; n = 4 independent biological replicates). Genes associated with cell migration, ECM organisation or the immune response are indicated (blue bars). c Volcano plot of cancer progression genes. Genes significantly differentially regulated between Met4 and Met4 Mena−/− cells by at least two-fold are labelled. Black arrowheads, the most differentially regulated gene in Met4 and Met4 Mena−/− cells, respectively. d Workflow for quantification of recruitment of specific regions of chromatin to the nuclear lamina by DamID. Green arrows, adenine methylation (m6A) in GATC motifs proximal to Dam. e Lamin B1 DamID sequencing (DamID-seq) tracks generated from Met4 and Met4 Mena−/− cells. The highest-scoring putative enhancer region associated with PTX3 (GeneHancer identifier GH03J157436) is indicated with a dotted box. Black bars, DamID-seq peaks (FDR < 5%; n = 2 independent experiments). Scale bar, 10 kb. f Nuclear lamina association of PTX3 quantified by lamin B1 DamID-qPCR. Black bar, median; light grey box, range. Statistical analysis, two-sided Student’s t-test (n = 4 independent experiments). g Quantification of PTX3 expression by RT-qPCR. GAPDH-normalised gene expression was expressed relative to Met4 cells. Black bar, median; light grey box, range. Statistical analysis, two-sided Student’s t-test (n = 3 independent experiments). h Subnetwork analysis of PTX3-associated genes from the gene expression analysis in (c). i Correlation of ENAH and PTX3 expression in patient-derived cSCC cell lines (GEO series accession identifier GSE98767). Pearson correlation coefficient = 0.487; two-sided P = 6.87 × 10⁻⁴ (n = 45 samples from n = 3 independent replicates). Artwork in (d) was adapted from Byron, A., Bernhardt, S., Ouine, B. et al. Integrative analysis of multi-platform reverse-phase protein array data for the pharmacodynamic assessment of response to targeted therapies. Scientific Reports 10, 21985 (2020). 10.1038/s41598-020-77335-0.

