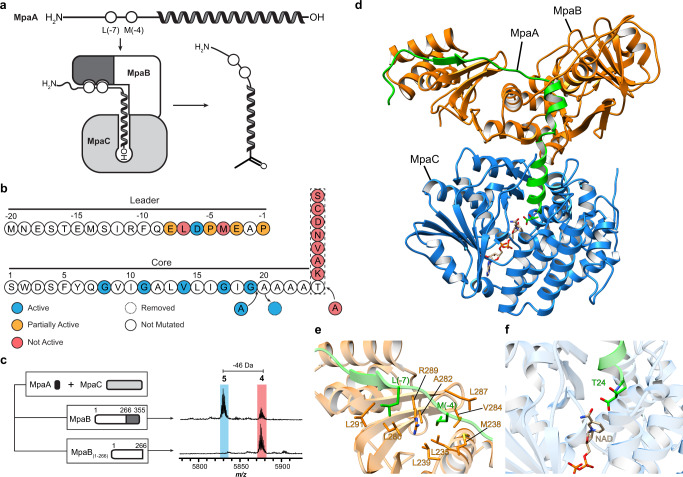
Fig. 4. Characterization of ketone intermediate formation by MpaB and MpaC.
a Proposed interaction model for MpaA, MpaB, and MpaC. The RRE domain (dark grey) of MpaB interacts with the conserved leader region of MpaA. The C-terminus (depicted as “-OH”) of MpaA is directed into the active site of MpaC for modification. b Summary of MpaA variant processing upon E. coli co-expression with MpaB/C. c Mass spectra of MpaA after co-expression with MpaC, and MpaB or MpaB1-266. The RRE domain of MpaB is dark grey. d The structure of MpaA1-MpaB-MpaC predicted using AlphaFold-Multimer40. MpaA1, MpaB, and MpaC are shown as cartoons in green, orange, and blue, respectively. The positioning of cofactor NADP was imported using a homologous alcohol dehydrogenase (PDB ID: 6C76) as a template. e, View of the leader peptide-RRE domain binding interface40. Select residues of MpaA and MpaB are in green and orange, respectively. f View of the C-terminal Thr24 of MpaA in the substrate-binding pocket of MpaC.

