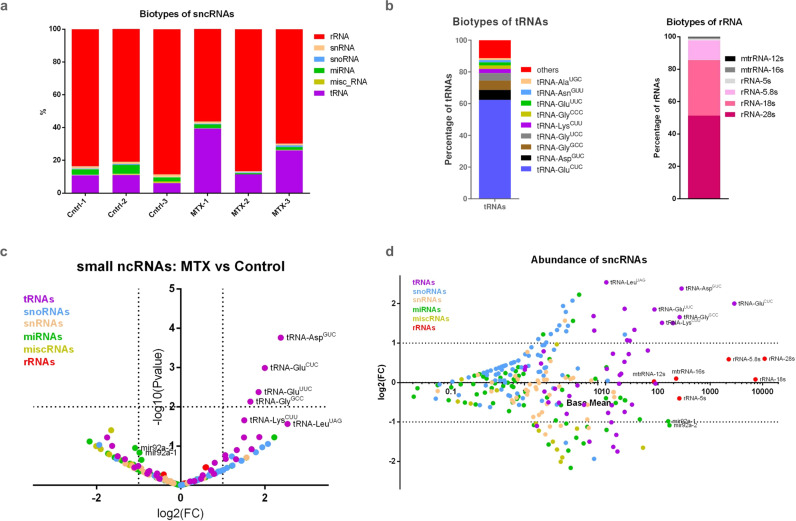
Fig. 3. Paternal MTX injection alters sperm sncRNAs.
a Histogram representing the comparison from sperm sncRNA on control (Ctrl1-3) and 10MTX (MTX-1-3) treated males. b Histogram displaying biotypes of tRNAs and rRNAs from sperm of MTX treated males. See also Supplementary Data 1 for a and b. c Volcano plot of depicting the fold changes in sperm sncRNAs identified as being differentially expressed within control versus MTX-treated males. Analysis of differential expression was performed by using DESeq2 which use the two-tailed Wald test. d MA plot displaying normalized counts (base mean) for different sncRNAs. Dotted lines depict thresholds values for significantly up and down-regulated (±≥1 log2 fold change and -log10 P value ≥ 1.3). See also Supplementary Data 2 for c and d.

