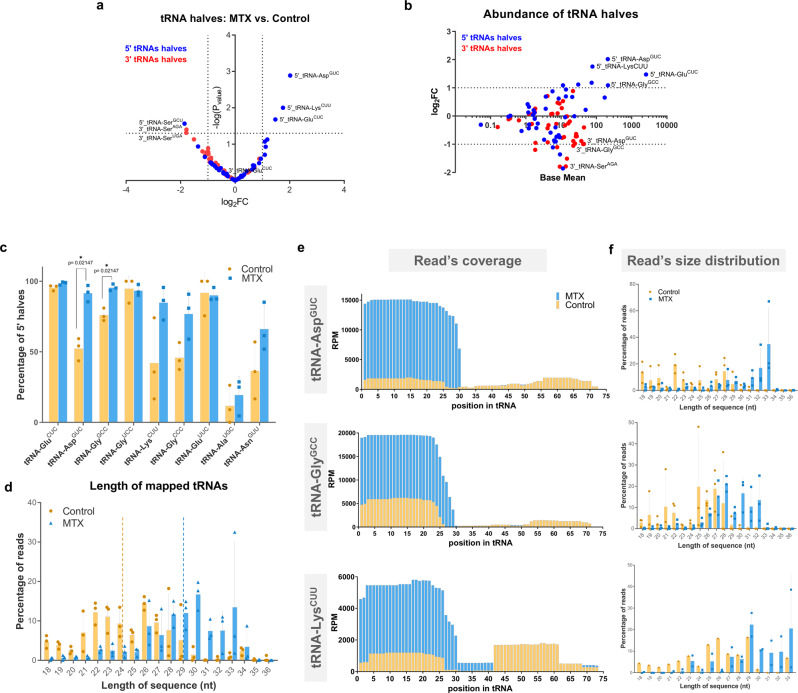
Fig. 4. Paternal MTX injection induced the expression and cleavage of specific tRNAs.
a Volcano plot of depicting the fold changes in sperm 5′ and 3′ tRNA halves as being differentially expressed within control versus MTX treated males. Analysis of differential expression was performed by using DESeq2 which use the two-tailed Wald test. b MA plot displaying normalized counts (base mean) for different 5′ and 3′tRNA halves. Dotted lines depict thresholds values for significantly up and down-regulated (±≥1 log2 fold change and -log10Pvalue ≥ 1.3). See also Supplementary Data 3 for a and b. c Histogram displaying percentage of 5′ halves relative to their corresponding 3′ halves from different tRNAs affected by MTX treatment. Asterisk indicated significant differences analyzed by multiple unpaired t-student’ test followed by a correction for multiple comparison (Holm-Sidak method, with alpha = 0.05)). d Histogram showing the length variation of mapped tRNA reads on control and MTX-treated males. Dotted lines represent the median length. Histogram showing the read coverage (e) and size (f) distribution for the most abundant and having a significant increase in the 5’tsRNA (tRNA-GluCUC, tRNA-AspGUC, and tRNA-GlyGCC) between control and MTX. Data on c, d and f represent three biologically independent replicates (n = 3) composed by a pool of 9 males’ sperm. Values are means ± SD. See also Supplementary Data 4 for c–f.

