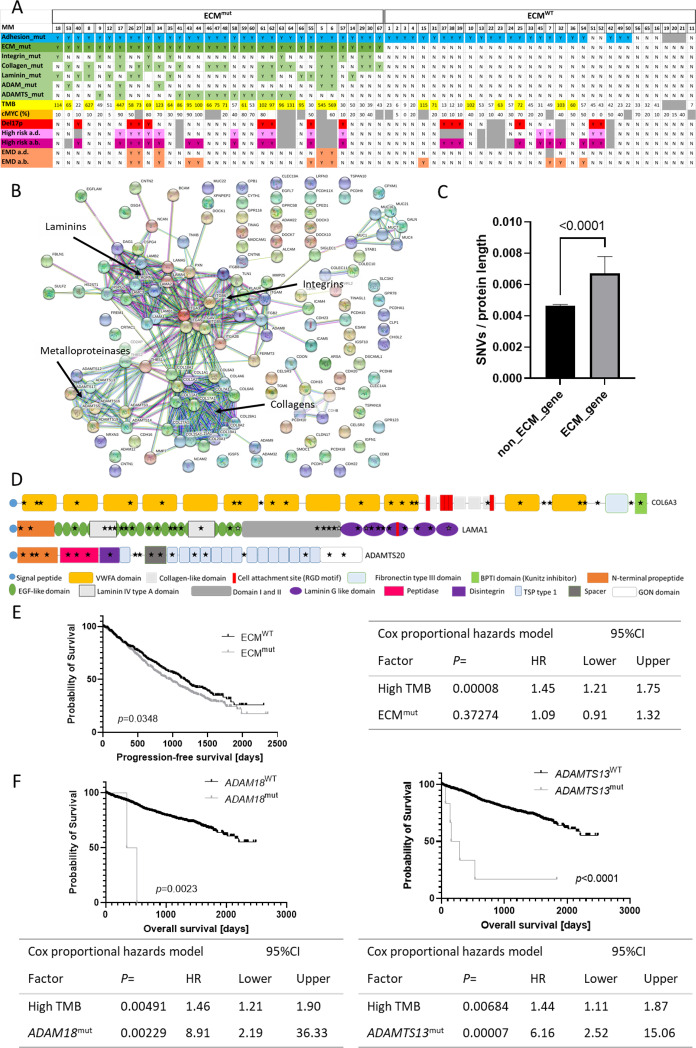
Fig. 1. ECM gene mutations as prognostic markers in MM.
A Representation of the mutation status of patients with and without mutations in adhesion genes (blue), ECM genes (green) (ECMmut and ECMWT) and the TMB (yellow). Further, cMyc protein expression (orange), del17p status (red), overall high-risk status at diagnosis (a.d.) (light pink) and at biopsy (a.b.) (dark pink) and information on the presence of extramedullary disease (EMD) (salmon) are shown. Individual patients are separated by small gaps. B STRING network analysis of mutated adhesion genes in our WES study cohort revealed clusters in integrin, collagen, laminin and metalloproteinase genes (ADAMs, ADAMTS). C ECM genes contained significantly more SNVs relative to the protein length than other protein-coding genes within the MMRF WES dataset. Non-protein-coding genes were excluded from the analysis (Table S1). Data shown is median with 95% CI. Statistical test was Mann-Whitney-U. D Visual representation of domains and structure of proteins encoded by the three ECM genes most recurrently affected by mutations: COL6A3, LAMA1 and ADAMTS20. For all other ECM molecules and more information on mutations see Fig. S1 and Table S3. Information on protein structure and domains was obtained from the Uniprot knowledgebase. E PFS was significantly shorter (median PFS 938.0 vs. 1176.0 days) in ECMmut patients compared to ECMWT patients. Comparisons were performed using the Kaplan Meier method and Log Rank test. Table shows Hazard ratios (HR) for high TMB and ECM mutations calculated using the Cox proportional hazards model in SPSS. F Mutations in ADAM18 and ADAMTS13 were associated with a significantly shorter OS (median 349.0 days vs. not reached and 154.0 vs. not reached, respectively). Tables below Kaplan Meier plots show HRs calculated using the Cox proportional hazards model for high TMB and ADAM18mut or ADAMTS13mut. Graphs were created using GraphPad Prism 9.

