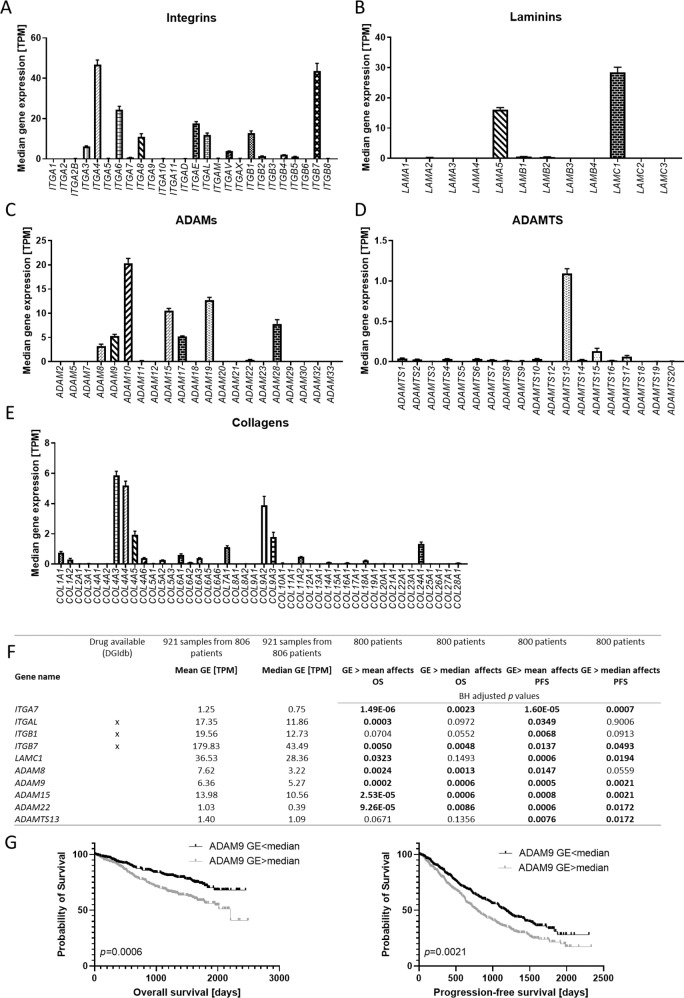
Fig. 2. ECM gene expression levels as prognostic markers in MM.
Gene expression of integrin (A), laminin (B), ADAM (C), ADAMTS (D) and collagen (E) genes determined by RNA sequencing of 921 samples from 806 patients of the MMRF cohort. Data shown is median transcripts per kilobase million (TPM) with 95% CI. F Summary of selected genes where a GE higher than the mean or median is significantly associated with PFS and/or OS. Comparisons were performed using the Kaplan Meier method and Log Rank test. P values were adjusted for multiple hypotheses using the Benjamini-Hochberg (BH) correction in R. For Kaplan Meier plots see Fig. S2. DGIdb was used to reveal druggable targets. G Exemplary Kaplan Meier plots comparing PFS and OS of patients with a high (>median) or low (<median) ADAM9 GE. Statistical test was Log Rank test. Graphs were created using GraphPad Prism 9.

