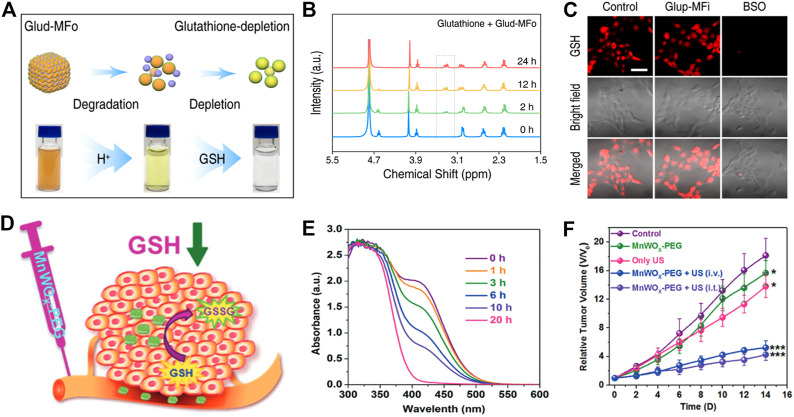
FIGURE 6.
(A) Schematic diagram of Glud-MFo-c degradation in an acidic environment. (B) Hydrogen-nuclear magnetic resonance spectra (1H NMR) of GSH after incubation with Glud-MFo-c at different time points. (C) Comparison of GSH content in confocal images after different treatment of 4T1 cells. Reproduced with permission. Copyright 2020 American Chemical Society. (D) A diagram of GSH depletion mechanism in tumor tissue. (E) The GSH consumption performance of MnWOX-PEG at different time points. (F) Tumor growth of mice after different treatments. Reproduced with permission. Copyright 2019 John Wiley & Sons.

