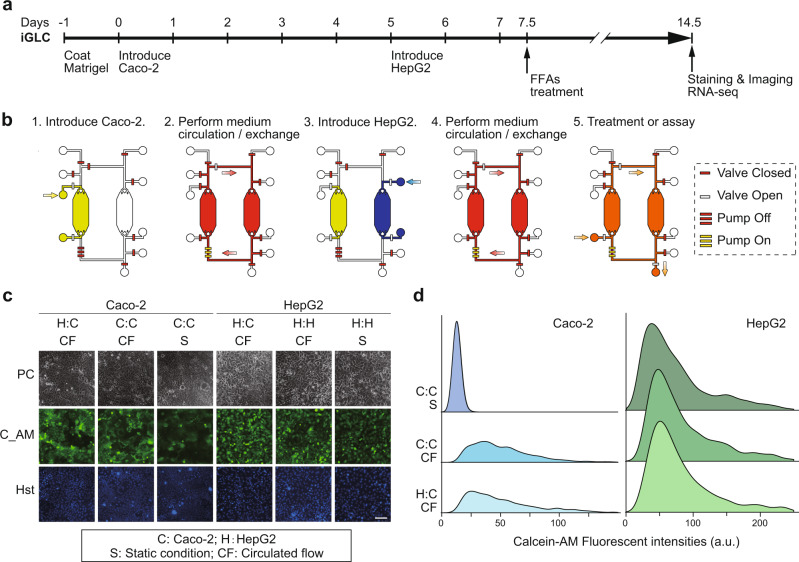
Fig. 2. Establishment of the GLA in the iGLC platform.
a, b Experimental procedure to culture Caco-2 and HepG2 cells in an iGLC platform (see also Supplementary Methods). Briefly, after a microfluidic channel was washed with a fresh cell culture medium, all valves were closed to prevent air contamination into the chip. Two valves next to the cell culture chamber were opened, and cell suspensions of Caco-2 and HepG2 cells were separately introduced into the corresponding chambers. After 1 day of incubation at 37 °C to settle down the cells, the pump was actuated to circulate the medium. The cell culture medium was changed every 6 h. c Phase-contrast (PC) and fluorescent micrographs of Caco-2 and HepG2 cells with closed medium circulation in the iGLC platform and stained with Calcein AM (C_AM) and Hoechst 33258 (Hst). For comparison, we also assessed individually cultured Caco-2 (C:C) and HepG2 (H:H) cells under circulation flow (CF) and static conditions (S). H:C represents co-cultured Caco-2 and HepG2 cells. The scale bar represents 100 µm. d Ridgeline plots showing single-cell profiling of Caco-2 and HepG2 cells stained with Calcein AM. For comparison, we also assessed individually cultured Caco-2 (C:C) and HepG2 (H:H) cells under circulation flow (CF) and static conditions (S). H:C represents co-cultured Caco-2 and HepG2 cells. The p-values were estimated with the Tukey–Kramer test and are presented in Supplementary Table S1 for the Caco-2 and Supplementary Table S2 for HepG2 cells.

