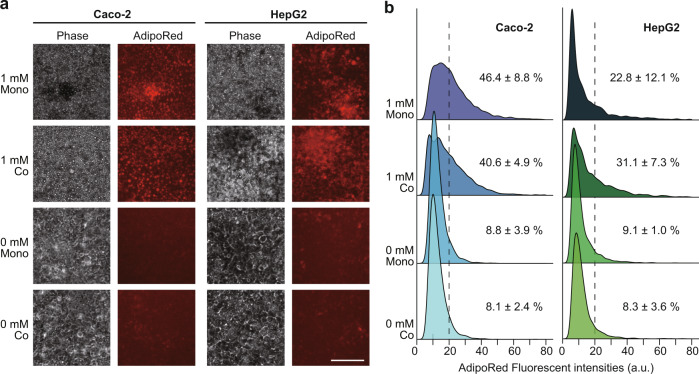
Fig. 3. Lipids accumulated in both Caco-2 and HepG2 cells after 7-day FFAs treatment.
a Phase contrast and fluorescent micrographs of Caco-2 and HepG2 cells treated with FFAs (0 and 1 mM) for 7 days stained with AdipoRed lipid fluorescent dye. The scale bars represent 100 µm. b Ridgeline plots to evaluate FFAs accumulation in individual cells [Caco-2 (left) and HepG2 (right)] after FFAs treatment for 7 days. The p-values were estimated with the Tukey–Kramer test and are presented in Supplementary Tables S5, S6 for the Caco-2 and HepG2 cells, respectively. Cells with over 20 of AdipoRed fluorescent intensity were considered as lipid accumulated cells. The data represent the mean ± standard deviation (n = 3).

