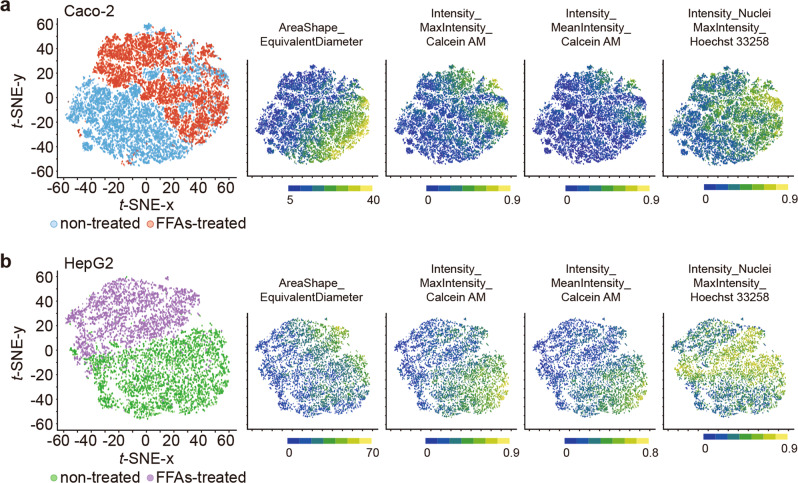
Fig. 5. Single-cell profiling for the t-SNE analysis.
a, b Two-dimensional t-SNE plots of microscopic single-cell profiling of co-cultured Caco-2 (a) and HepG2 (b) treated with 1 mM of FFAs or no treatment and stained with Calcein AM cellular and Hoechst 33258 nuclei markers (n = 3). The most distinguishable cellular parameters (AreaShape_EquivalentDiameter, Intensity_MaxIntensity_Calcein AM and Intensity_MaxIntensity_Hoechst 33258) are shown in the corresponding t-SNE plots, as well as the boxplots in Supplementary Fig. S11. The p-values are presented in Supplementary Tables S11,S12.

