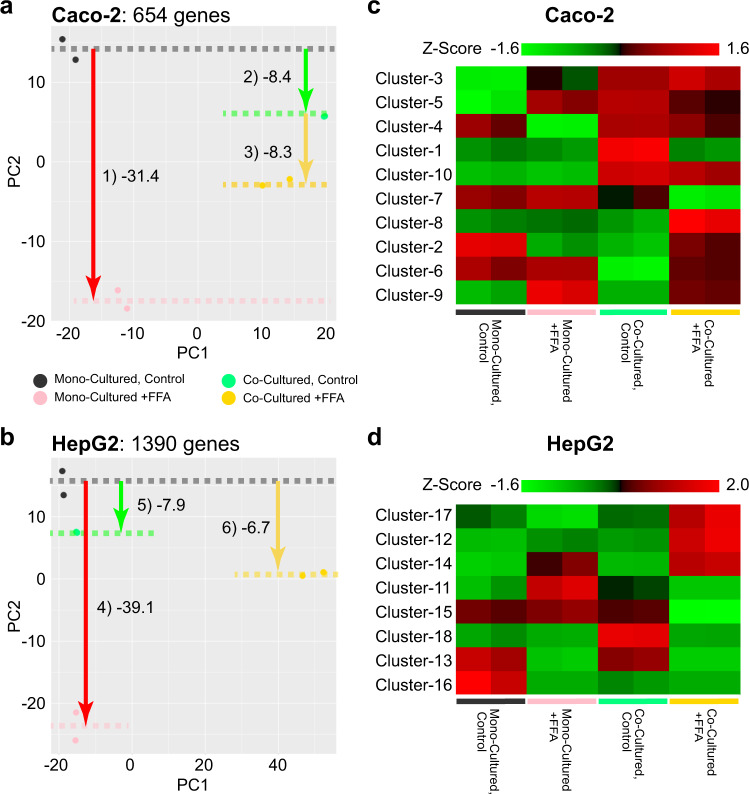
Fig. 6. Gene expressions of the effects of FFAs treatment for 7 days and crosstalk with the in vitro human GLA model.
a, b PCA results for DEGs obtained from the Caco-2 (a) and HepG2 (b) experimental sets. The mean PC2 values among the replicates are shown with dotted lines. For these diagrams, the gene name and change direction shown in (a, b) were considered. c, d Heat maps for the DEGs. Z-values of the expression profiles are shown.

