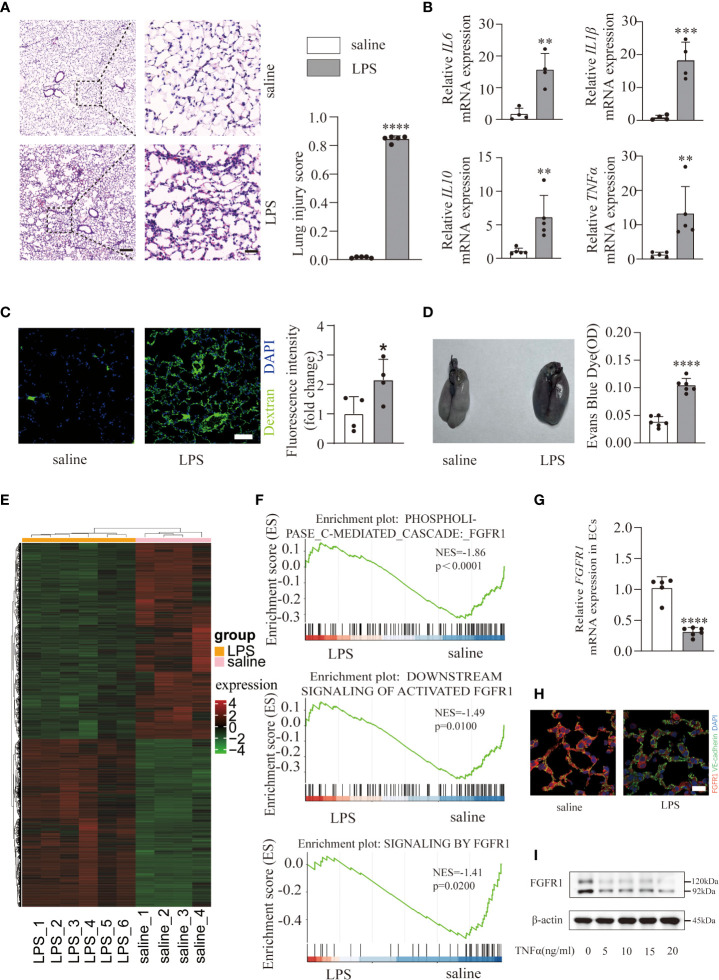
Figure 1.
An LPS-induced ALI/ARDS mouse model was constructed and endothelial FGFR1 was decreased in the LPS group. Mice were treated with saline and LPS (10 mg/kg) intratracheally for 24 h. Representative lung sections were stained with hematoxylin and eosin and lung injury scores were quantified (A), n=5 per group. Scale bars: 200 µm (left) and 40 µm (right). Total RNA was isolated from saline- and LPS-treated mouse lung tissues. Relative mRNA levels of inflammatory cytokines (IL6, IL1β, IL10, TNFα) were significantly increased in mice treated with LPS compared with saline-treated mice, as determined by RT-PCR analysis (B). n=4 or 5 per group. Images of FITC-dextran were costained with DAPI and quantified by the mean fluorescence intensity of FITC-dextran (C). n=4 per group. Scale bars: 50 µm. Whole lung tissues were stained with EBD-stained lungs (left) and EB content in the lungs (right) was quantified (D). n=6 per group. A gene expression heatmap is shown, and hierarchical clustering was based on 2713 upregulated genes and 3167 downregulated genes between lung ECs intratracheally treated with saline and LPS (E). n=4 or 6 per group. Gene set enrichment analysis of differentially expressed genes in the saline and LPS groups suggested decreased endothelial FGFR1 in the LPS group (F). The relative mRNA expression of pulmonary endothelial FGFR1 in LPS-treated mice was examined (G). n=5 or 6 per group. FGFR1 was costained with VE-cadherin in the lung sections. Red indicates FGFR1, green indicates VE-cadherin (H). n=4 per group. Scale bars: 20 µm. HUVECs were treated with 0, 5, 10, 15 and 20 ng/ml of TNFα for 12 hours. Cell lysates were analyzed by western blotting with FGFR1 and β-actin antibodies (I). Each bar represents the mean ± SD; *p < 0.05, **p < 0.01, ***p < 0.001 and ****p < 0.0001.

