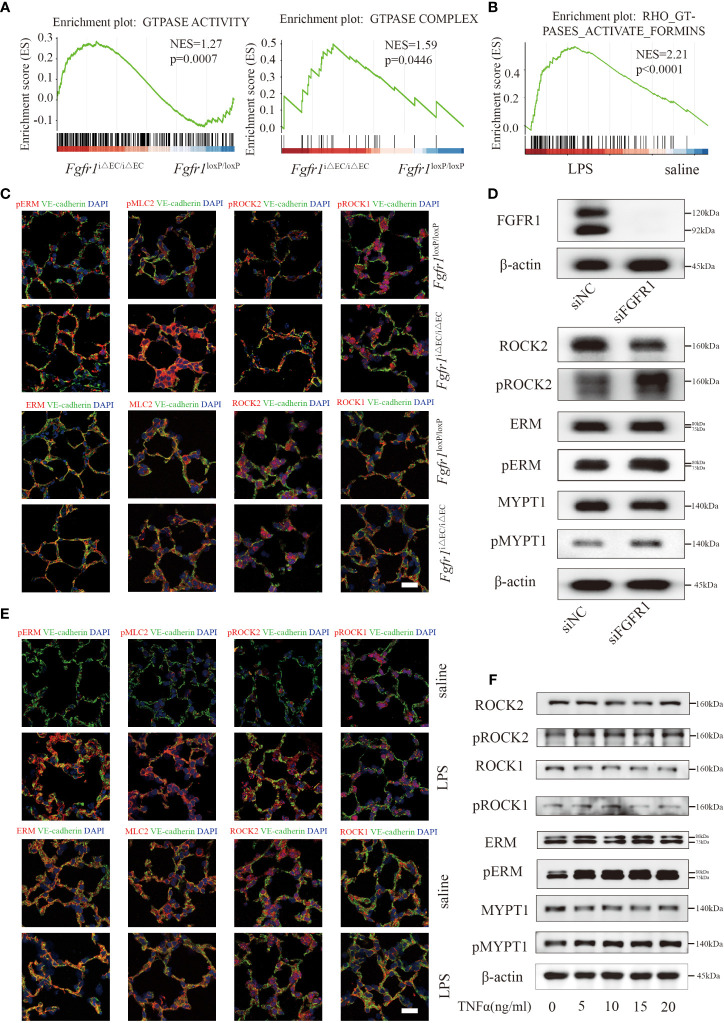
Figure 3.
Endothelial ROCK2 was activated in ALI/ARDS model and functioned as a downstream of FGFR1. RNA-seq analysis was performed on ECs isolated from LPS-treated Fgfr1 iΔEC/iΔEC mice and Fgfr1 loxP/loxP mice. Gene set enrichment analysis of differentially expressed genes showed enrichment of GTPase activity and the GTPase complex (A), which are related to RhoA activation. RhoA GTPase activation was enriched by GSEA in the LPS group compared with the saline group (B). Endothelial ROCK2 activity was assessed by the colocalization of pERM, ERM, pMLC2, MLC2, pROCK2, ROCK2, pROCK1 and ROCK1 (red fluorescent protein) with VE-cadherin (green fluorescent protein) by immunofluorescent staining. Representative images of immunofluorescent staining of endothelial ROCK2 activity in the Fgfr1 iΔEC/iΔEC mice vs the Fgfr1 loxP/loxP mice group (C) and the saline vs LPS group (E) are shown. n=3 per group. Scale bars: 40 µm. HUVECs were transfected with siNC or siFGFR1 for 48 h. The expression of FGFR1 after siRNA transfection was detected by WB with FGFR1 and β-actin antibodies. The phosphorylation of ERM, MYPT1 and ROCK2 was assessed (D). In addition, HUVECs were treated with 0, 5, 10, 15 and 20 ng/ml of TNFα for 12 h, and ROCK2 activity was assessed by WB (F).

