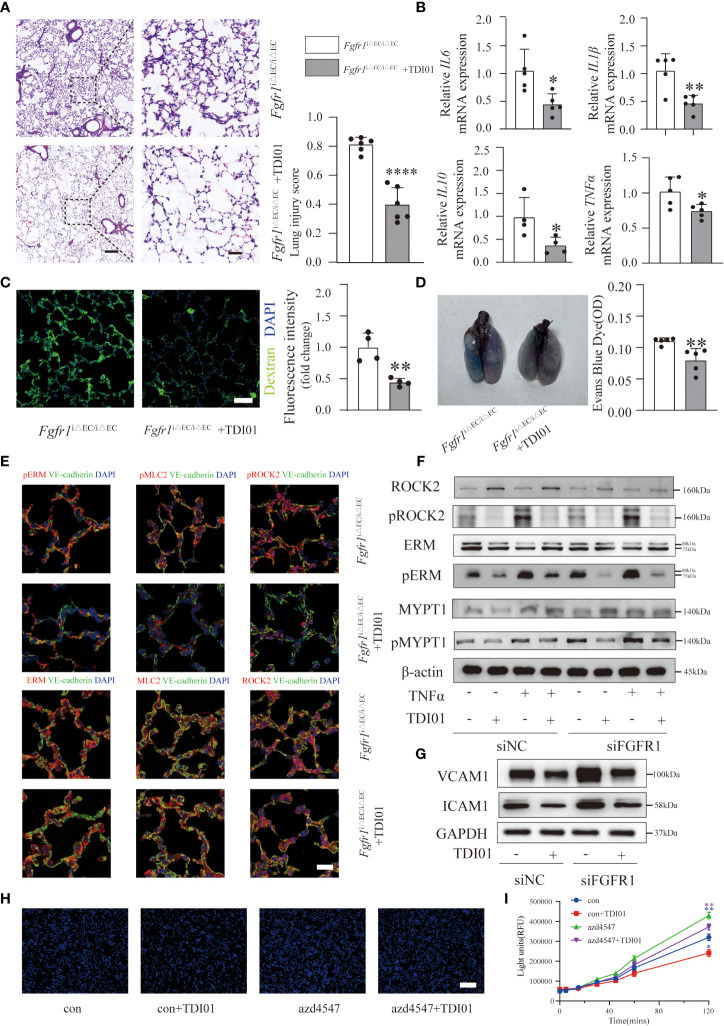
Figure 5.
TDI01 effectively attenuated ALI/ARDS in Fgfr1 iΔEC/iΔEC mice and endothelial dysfunction in FGFR1-deficient HUVECs. Inhibition of ROCK2 by TDI01 suppressed the inflammatory response of Fgfr1 iΔEC/iΔEC mice. Representative images stained with hematoxylin and eosin and lung injury scores are shown (A). n=6 per group. Scale bars: 200 µm (left) and 40 µm (right). The relative mRNA expression of inflammatory cytokines (IL6, IL1β, IL10, TNFα) was reduced in the TDI01-pretreated Fgfr1 iΔEC/iΔEC group (B), n=4 or 5 per group. Vascular barrier dysfunction in Fgfr1 iΔEC/iΔEC mice was rescued by TDI01, as indicated by decreased leakage of FITC-dextran (C), n=4 per group, scale bars: 50 µm and EBD (D), n=5 per group. Endothelial ROCK2 activity was inhibited by TDI01 in Fgfr1 iΔEC/iΔEC mice and was assessed by the colocalization of pERM, ERM, pMLC2, MLC2, pROCK2 and ROCK2 (red fluorescent protein) with VE-cadherin (green fluorescent protein) by immunofluorescent staining. Representative images are shown (E). n=5 per group. Scale bars: 40 µm. HUVECs were transfected with siNC or siFGFR1 and pretreated with TDI01 (0, 10 µM) for 24 h, and then treated with or without 20 ng/ml of TNFα for 12 h. ROCK2 activity was determined by the phosphorylation of ERM, MYPT1 and ROCK2 (F). HUVECs were transfected with siNC or siFGFR1 and pretreated with TDI01 (0, 10 µM) for 24 h, and then treated with 20 ng/ml of TNFα for 12 h. The expression of VCAM1 and ICAM1 was assessed by WB (G). HUVECs were pretreated with TDI01 (0, 1 µM) for 24 h, treated with or without azd4547 (1 µM) for 12 h and then challenged by 20 ng/ml of TNFα for 12 h. Hoechst 33342-labeled monocytes were added to each well and co-incubated for 4 h. Representative images of adhered Hoechst 33342-labeled monocytes are shown (H). n=3 per group, scale bars: 200 µm. HUVECs were pretreated with TDI01 (0, 1 µM) for 24 h, and treated with or without azd4547 (1 µM) for 12 h and then were plated for permeability assay. FITC-dextran and TNFα (20 ng/ml) were simultaneously administered into HUVECs and the fluorescence intensity were recorded at 0, 5, 15, 30, 45, 60, 120 min (I). n=3 per group. Each bar represents the mean ± SD; *p < 0.05, **p < 0.01 and ****p < 0.0001.

