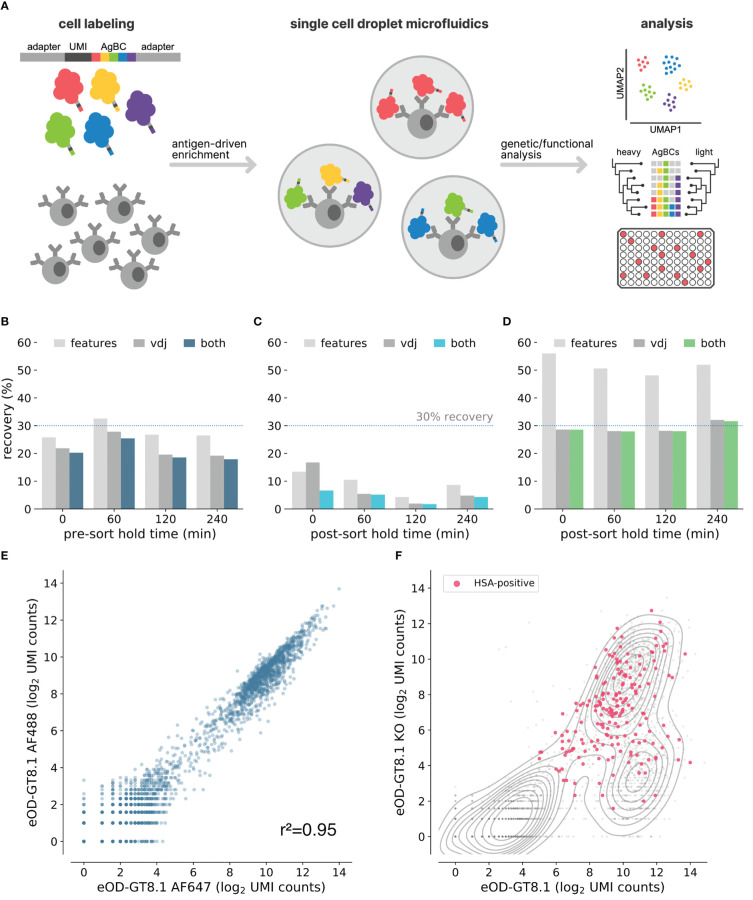
Figure 1.
Optimization of next-generation AgBCs. (A) Schematic overview of the antigen barcoding approach. (B) Pre-optimization recovery of features (light gray), paired VDJ sequences (dark gray) or both features and VDJ (blue) when sorting cells after pre-sort hold times of varying duration. (C) Pre-optimization recovery of features (light gray), paired VDJ sequences (dark gray) or both features and VDJ (blue) when processing sorted cells after post-sort hold times of varying duration. (D) Optimized recovery of features (light gray), paired VDJ sequences (dark gray) or both features and VDJ (green) when processing sorted cells after post-sort hold times of varying duration. (E) Correlation between recovery AgBC UMI counts of two differently barcoded aliquots of eOD-GT8.1. Plot was generated in scab using scab.pl.feature_scatter(). (F) Kernel density estimate plot of the log2-normalized UMI counts of eOD-GT8.1 AgBC and eOD-GT8.1 KO AgBC is shown in gray. Cells classified as positive for an HSA AgBC are highlighted in pink. Plot was generated in scab using scab.pl.feature_kde().

