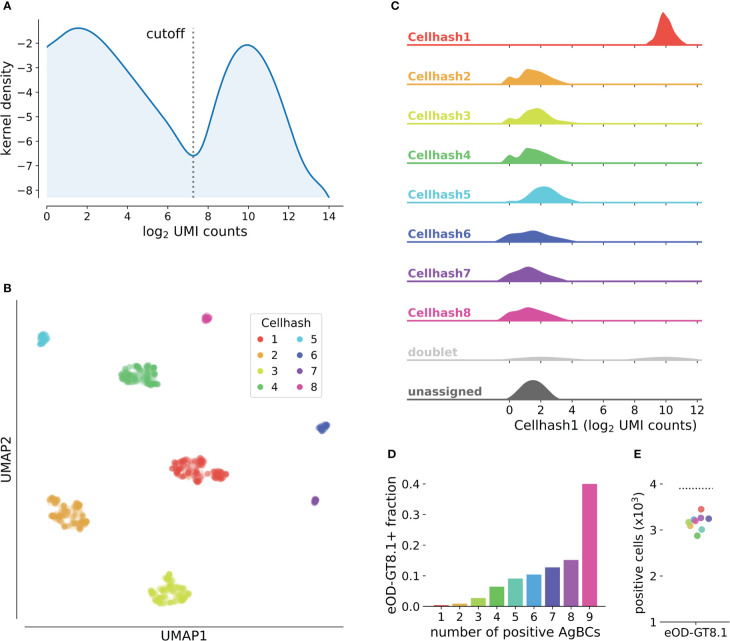
Figure 3.
Classification of cell hashes and AgBCs. (A) Representative KDE plot of log2-transformed cell hash UMI counts. The classification cutoff is highlighted, and clearly separates the positive and negative cell hash populations. KDE plots are optionally generated when running scab.tl.demultiplex(). (B) UMAP plot of cells clustered using log2-transformed cell hash UMI counts. Cells are colored by cell hash assignment. Of note, cell hashes 1-4 each comprise 20-25% of all input cells, while cell hashes 5-8 each comprise 2-5% of all input cells. (C) Ridgeplot showing the distribution of log2-transformed UMI counts of cell hash 1 for all cell hash assignment groups. Plot was generated with scab by calling scab.pl.cellhash_ridge(). (D) Fraction of cells classified as positive for increasing numbers of differently barcoded aliquots of eOD-GT8.1 AgBC when performing classification on each AgBC separately. A total of 9 different AgBCs were used, meaning approximately 40% of all recovered cells were classified as positive for all AgBCs. (E) Fraction of cells classified as positive for each of 9 differently barcoded eOD-GT8.1 AgBCs when classification was performed separately for each AgBC (colored points). The dashed line shows the number of cells classified as eOD-GT8.1 positive when using a specificity group containing all 9 eOD-GT8.1 AgBCs.

