Figure 4.
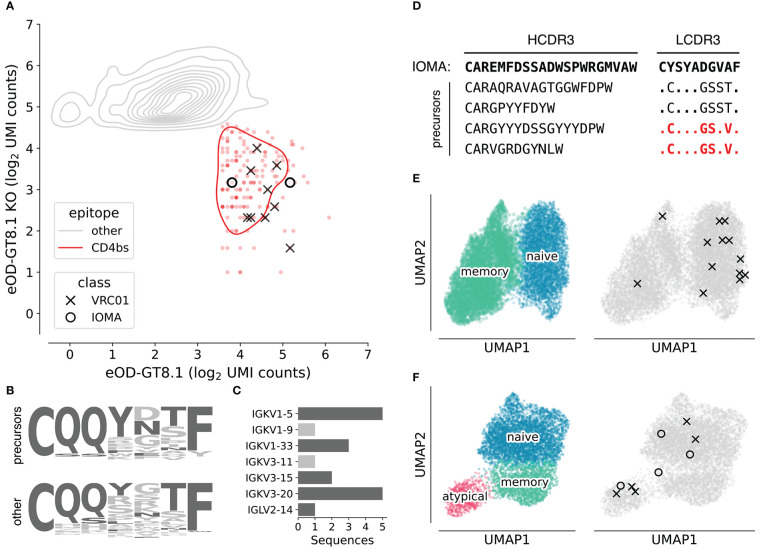
Characterization of VRC01-class and IOMA-class HIV bnAb precursors. (A) Density plot of log2-normalized AgBC UMI counts for eOD-GT8.1 (x-axis) and eOD-GT8.1 KO (y-axis). Cells positive for eOD-GT8.1 and negative for eOD-GT8.1 KO (indicating binding to the CD4bs epitope) are indicated in red, all others are in gray. VRC01-class (X) and IOMA-class (O) are highlighted. Plot was generated with scab by calling scab.pl.feature_kde(). (B) LCDR3 logo plots for all recovered VRC01-class precursors (top) and all other 5AA LCDR3s, which were not paired to a heavy chain encoding IGHV1-2 (bottom). Residues found in mature VRC01-class bnAbs are colored dark gray, all other residues are light gray. (C) Light chain V-gene use in isolated VRC01-class precursors. Light chain V-genes used by mature VRC01-class bnAbs are colored dark gray, all others are colored light gray. (D) Heavy chain and light chain CDR3 sequences for isolated IOMA-class precursors. LCDR3s that have been previously reported in IOMA-class precursors (Lee et al., 2021) are highlighted in red. (E) UMAP plots using single cell RNA-seq data for all recovered cells from D931. On the left, cells are colored by subset, with naive B cells in blue and memory B cells in green. The same UMAP embedding is plotted on the right in gray with cells encoding VRC01-class (X) or IOMA-class (O) precursors highlighted. (F) UMAP plots using single cell RNA-seq data for all recovered cells from D326651. On the left, cells are colored by subset, with naive B cells in blue, memory B cells in green, and atypical B cells in pink. The same UMAP embedding is plotted on the right in gray with cells encoding VRC01-class (X) or IOMA-class (O) precursors highlighted. Plots in (E) and (F) were generated with scab by calling scab.pl.umap().

