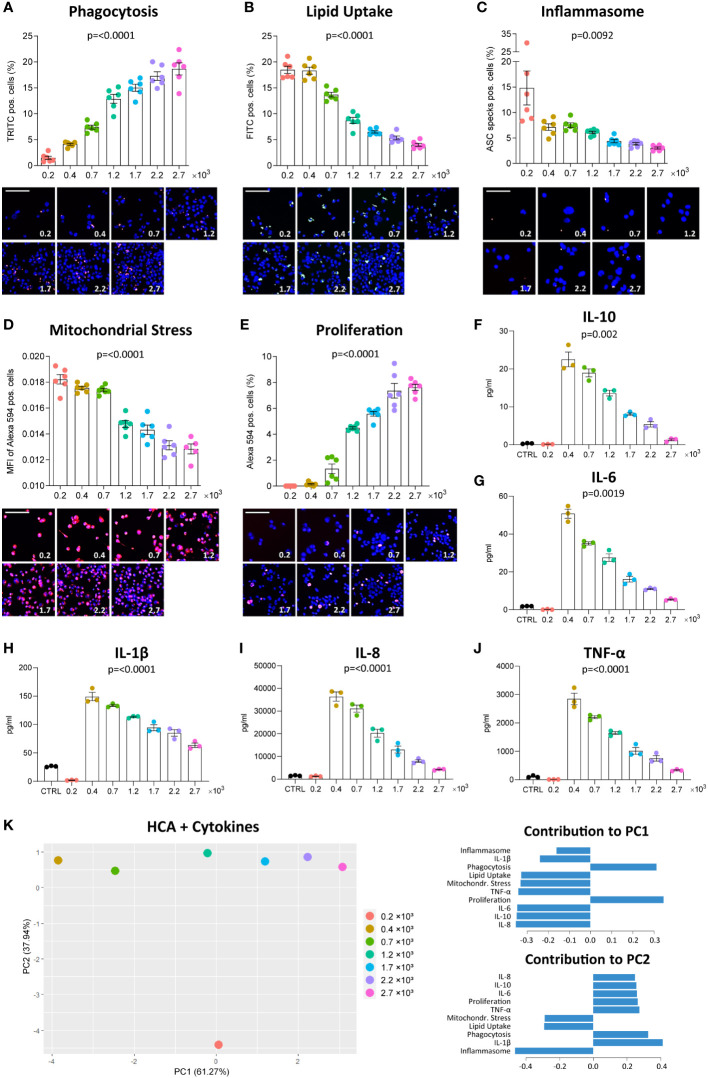
Figure 1.
Density affects MΦ function. THP-1 cells were seeded at the respective densities (0.2-2.7 x 10³ cells/mm²) and differentiated with 2000 nM PMA for 48 hours followed by a resting period of 24 hours. Phagocytosis of zymosan-coated beads (A, red), uptake of fluorescently-labelled oxLDL (B, green), inflammasome activation (C, red), mitochondrial stress in response to staurosporine (D, red) and EdU incorporation in proliferating cells (E, red) were assessed using the fluorescent imaging MacroScreen platform. Hoechst was used for nuclear labelling (blue). In the representative fluorescent images, the scale bar refers to 50 μM. In the representative images for the inflammasome assay, the scale bar refers to 25 μM. Secretion of IL-10 (F), IL-6 (G), IL-1β (H), IL-8 (I), and TNF-α (J) in response to 6-hour stimulation with 50 ng/ml LPS were measured by multiplex ELISA. Cells in the control (CTRL) condition were seeded at 1.7 x 10³ cells/mm² and not stimulated with LPS. The indicated p-values refer to overall significance, p-values of all group comparisons can be found in Supplementary Table 1 . (K) PCA plot of the high-content analysis (HCA) data and cytokine measurements with the factor loadings for PC1 and PC2. MFI: Mean fluorescence intensity.

