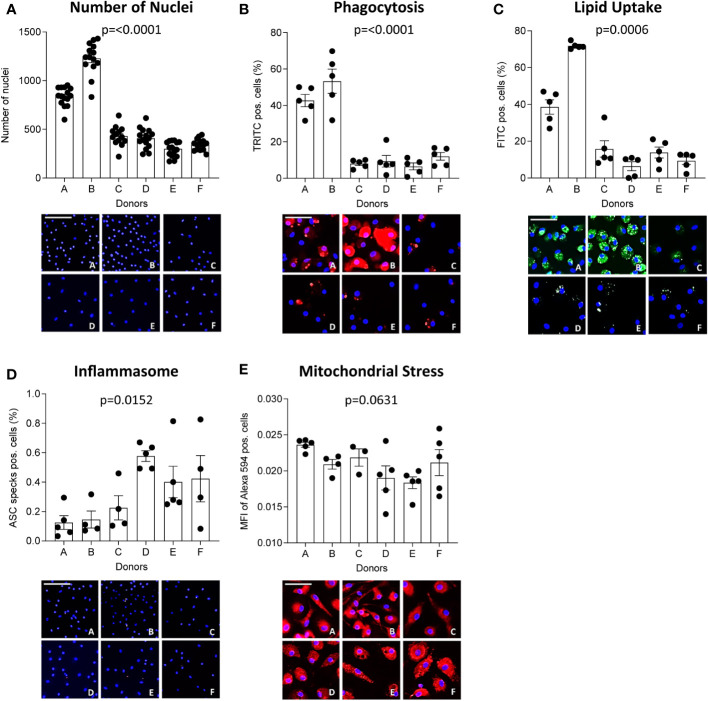
Figure 4.
MΦ function differs between donors. CD14-positive monocytes of 6 healthy donors were seeded at 13,000 cells/well and differentiated into MΦ for 7 days using 100 ng/ml macrophage colony-stimulating factor (M-CSF). The number of nuclei per donor at experimentation (A) is given. Their functional phenotype was assessed using the MacroScreen platform: phagocytosis (B, red), lipid uptake (C, green), inflammasome activation (D, red), and mitochondrial stress (E, red). The scale bar corresponds to 25 μM. The indicated p-values refer to overall significance, multiple comparison significance can be found in Supplementary Table 3 . MFI: Mean fluorescence intensity.

