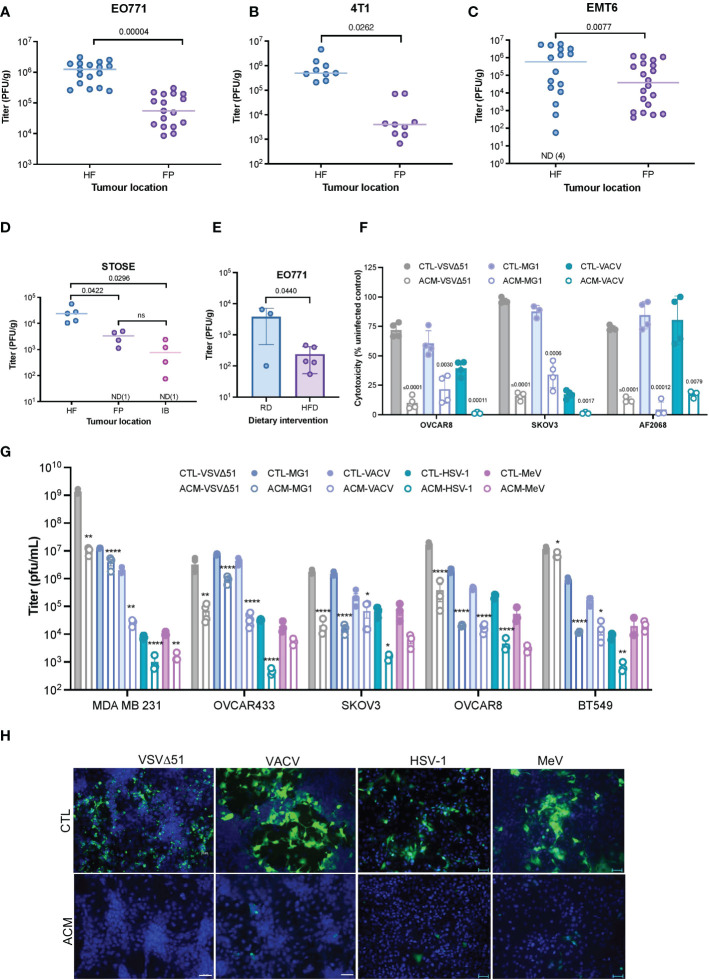
Figure 1.
A Fatty TME correlates with OV resistance. (A–C) Syngeneic EO771 (A), 4T1 (B), and EMT6 (C) breast tumors were seeded in the fat-pad (FP) or subcutaneously in the hind flank (HF) of Balb/c or C57BL/6 mice. Tumors were intratumorally treated with VSVΔ51 [1.5E8 plaque forming units (PFU)/tumor] and collected after 48 hours for quantification of infectious particles. ND, non-detected. Two-tailed, unpaired t-test. (D) STOSE cells were seeded in the HF, FP or intrabursally (IB) in FVB/N mice and treated with Maraba MG1 (1E7 PFU/tumor). Tumors were harvested 72 hours post-infection (hpi) for virus quantification by plaque assay. ND, non-detected. Lines indicates the median. One-way ANOVA, Tukey’s multiple comparison test. (E) Following a period of high-fat or regular diet feeding of C57BL/6 mice, EO771 cells were seeded in the FP. Tumors were intratumorally treated with Maraba MG1 (5E8 PFU/tumor) and harvested for quantification by plaque assay 48 hpi. Two-tailed, unpaired t-test. (F) Relative percentage (% compared to uninfected cells) of VSVΔ51-induced cytotoxicity in OVCAR8, SKOV3, and a primary ovarian cancer cell culture (AF2068) cultured in a regular growth medium (CTL) or a human breast adipocyte-conditioned medium (ACM) for 16 hours prior to infection with indicated OVs (48 hours, MOI 0.1). Results are displayed as mean ± SEM of four biological replicates. Two-tailed, unpaired t-test for each CTL and ACM pair. (G) Oncolytic virus titers from an OV-infected panel of breast and ovarian cancer cell lines [OVCAR8, MDA MB 231 and SKOV3 (MOI 0.1, 48 hpi), and OVCAR433 and BT549 (MOI 1, 48 hpi)] cultured in a regular growth medium or ACM were quantified by plaque assay. Data indicate the mean ± SEM of 3 to 5 biological replicates. Two-tailed, unpaired t-test for each CTL vs ACM pair. *p <0.05, **p<0.01, *p<0.05, **p<0.01, ****p<0.0001. (H) Representative immunofluorescence microscopy images of OV-infected (VSVΔ51 MOI 0.1 24 hpi, VACV MOI 0.1 48 hpi, HSV-1 MOI 0.1, 48 hpi, MeV MOI 1, 48 hpi) OVCAR8 cells are shown (VSVΔ51 and VACV, scale bar 20μm; HSV-1 and MeV scale bar represents 50μm). ns, non-significant.

