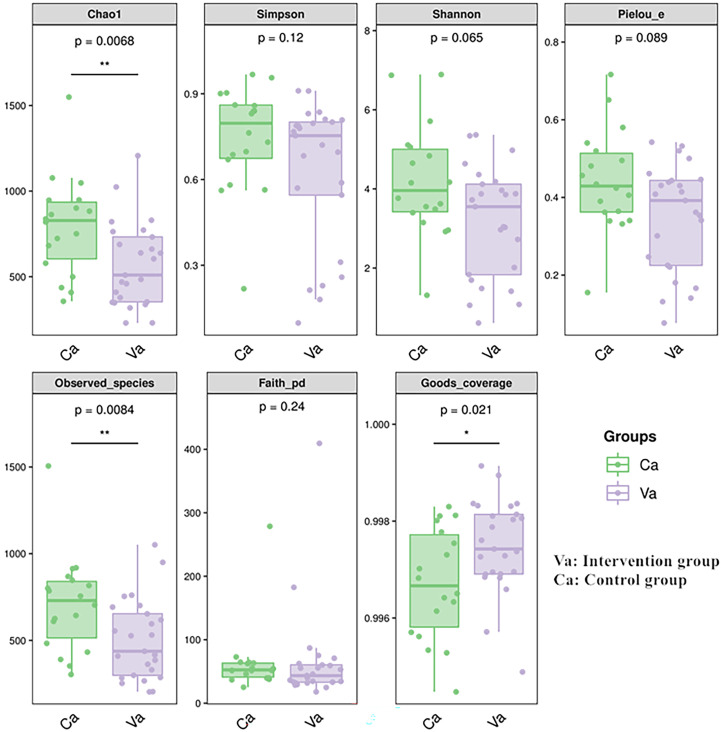
Figure 3.
The Chao1 and observed species indices of abundance were significantly lower in the heart failure group than in the control group. The meaning of each symbol in the boxplot was as follows. The upper and lower end line of the box were the upper and lower Interquartile range. Median line of the box was the median. The upper and lower margins were the maximum and minimum internal circumference (1.5 times of interquartile range). Numbers under the diversity index label are p-values.

