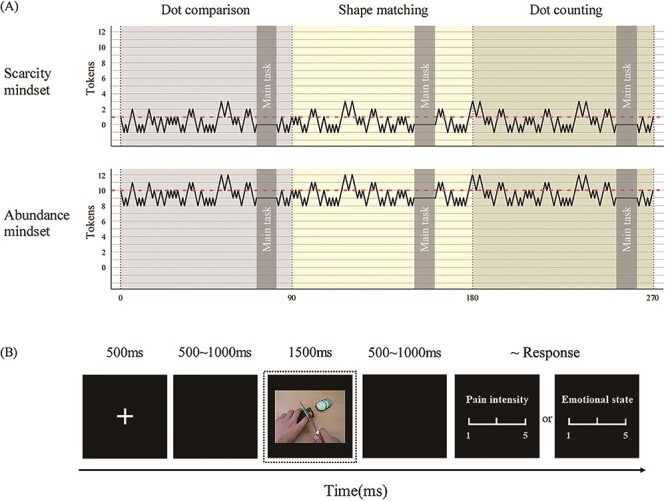
Fig. 1.

The experimental design. (A) The experimental structure. The dotted lines represent the threshold, and the broken lines represent the variation in the number of tokens around the threshold for each stage game in the scarcity (top panel) and abundance (bottom panel) mindsets. The dark shaded sections represent when participants performed the main task. (B) The flowchart describing the main task. ERP responses were locked to the panel of visual stimulus (marked with the dotted box).
