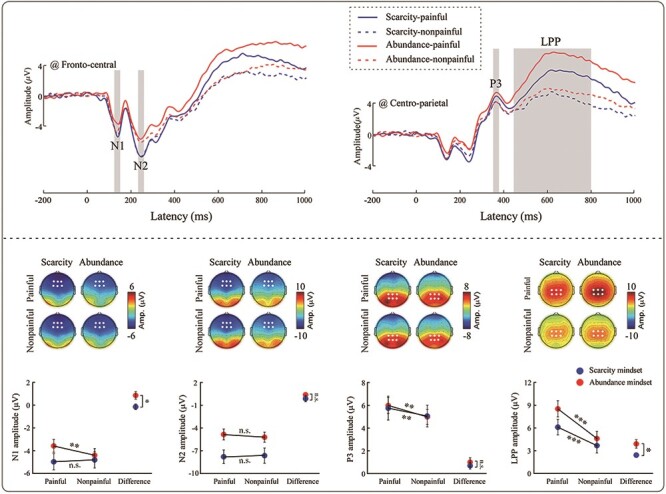
Fig. 3.

The ERP results. Averaged ERP waveforms (top panel) and scalp maps and bar charts (bottom panel) elicited by observing painful (solid) or nonpainful (dotted) pictures in the scarcity or abundance mindsets. Significant differences in ERP waveforms are marked with shaded squares. Electrodes used to estimate ERP amplitudes are marked with points on their respective scalp maps. Data in the bar charts are expressed as mean ± SEM. *P < 0.05; **P < 0.01; ***P < 0.001; n.s.: P > 0.05.
