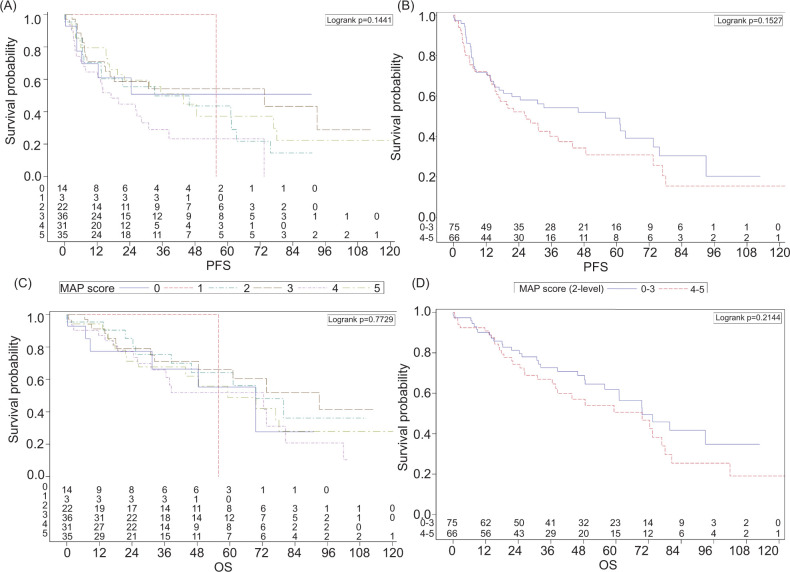
Figure 1:
Kaplan–Meier curves for stage T3/T4 renal cell carcinoma patients (n = 141) displaying median progression-free survival (PFS) or overall survival (OS) with either individualized (0–5) or dichotomized (0–3 vs 4–5) Mayo Adhesive Probability (MAP) scores. (A) Median PFS with individualized MAP Scores. (B) Median PFS with dichotomized MAP scores. (C) Median PFS with individualized MAP Scores. (D) Median OS with dichotomized MAP scores.

