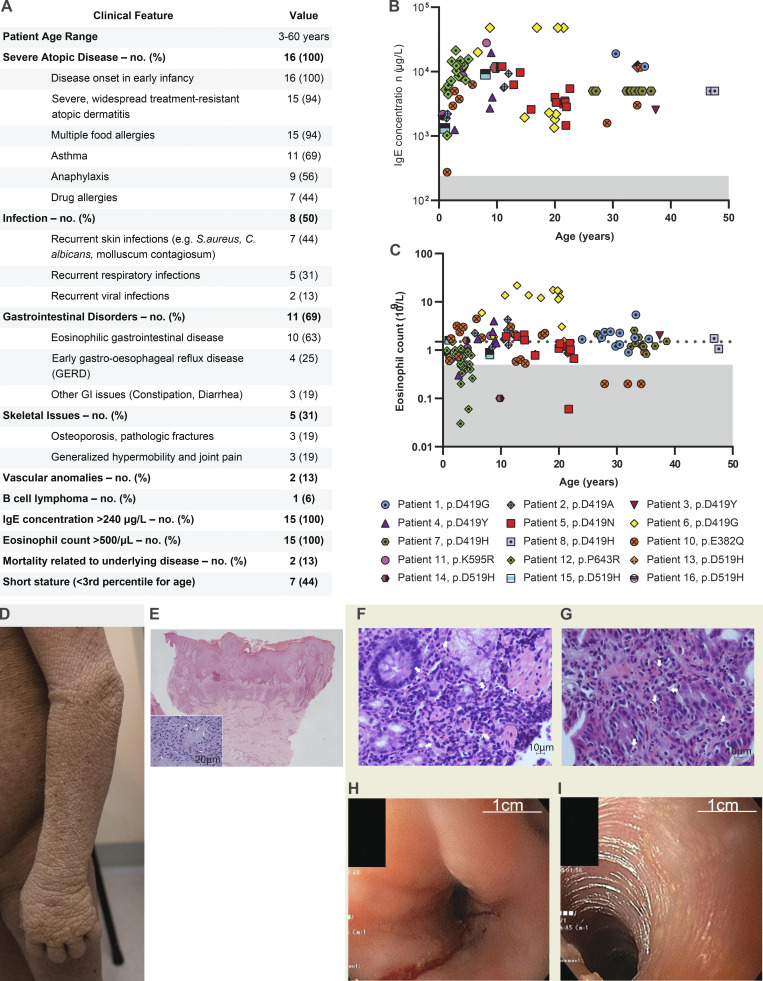
Figure 2.
Major clinical features of the 16 patients. (A) Tabulation and comparison of the clinical phenotype for 16 patients. Please note blood eosinophil and IgE values were only available for 15 patients. (B) IgE concentration in whole blood for 15 out of the 16 patients. Shaded area represents IgE < 240 µg/liter, which is the typical upper limit of normal. (C) Eosinophil count in whole blood for 15 out of the 16 patients. Shaded area represents counts <0.5 × 10⁹/liter, which is the typical upper limit of normal. The horizontal broken line denotes an eosinophil count of 1.5 × 10⁹/liter, since hypereosinophilic syndrome is traditionally defined as peripheral blood eosinophilia >1.5 × 10⁹/liter persisting ≥6 mo. (D) Photograph of widespread and severe atopic disease. (E) Photomicrograph of the skin biopsy showing marked pseudoepitheliomatous hyperplasia with acanthosis, hyperkeratosis, and focal parakeratosis, suggestive of lichen simplex chronicus (H&E stain, original magnification 2×). Moderate chronic inflammation within the papillary dermis in which scattered eosinophils (white arrows) are conspicuous (inset, H&E stain; original magnification, 40×). (F) Photomicrograph of duodenal biopsy showing abundant eosinophils (white arrows) amongst lymphocytes (H&E stain; original magnification, 40×). (G) Photomicrograph of gastric antral biopsy showing abundant infiltrate of eosinophils (arrows) amongst lymphocytes and plasma cells (H&E stain; original magnification, 40×). (H and I) Endoscopic images showing (H) furrowing and (I) trachealization in the middle esophagus, suggestive of eosinophilic esophagitis.

