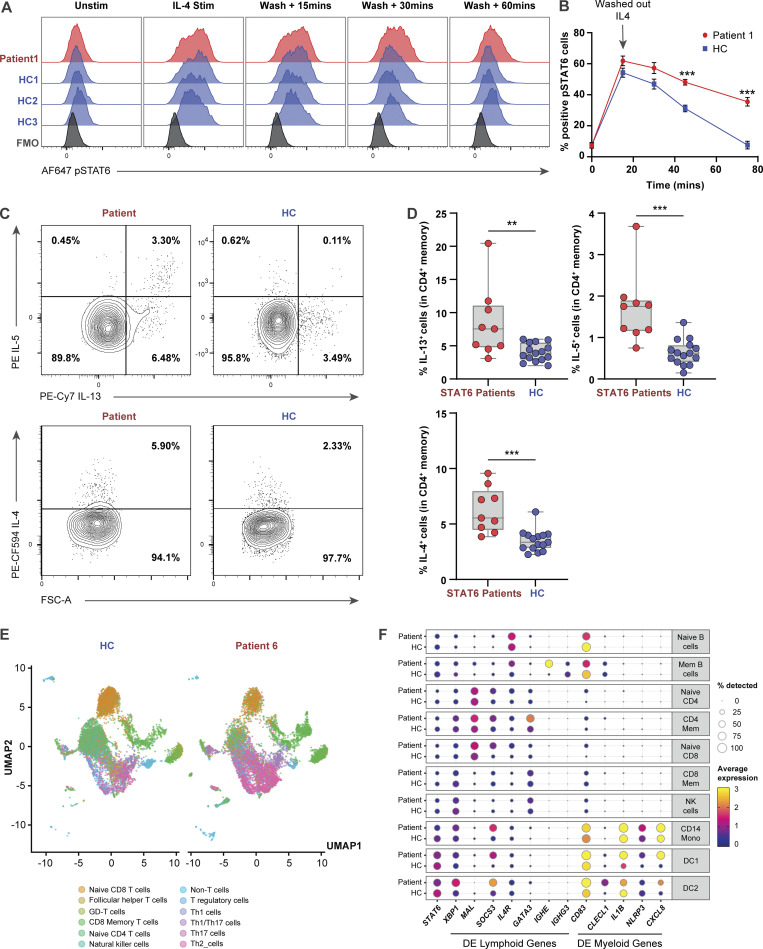
Figure 4.
Primary lymphocytes of STAT6 GOF patients display higher STAT6 activity and TH2 skewing. (A) Histograms showing phosphorylation of STAT6 in healthy control (blue) and patient (red) LCLs that were stimulated with IL-4 (10 ng/ml) for 15 min, washed with PBS and subsequently incubated in IL-4–free media for 15, 30, and 60 min. Gating strategy for pSTAT6+ cells can be found in Fig. S4 C. (B) Quantification of pSTAT6+ cells from three separate experiments done in A, multiple unpaired t test corrected for multiple comparison using the Benjamini–Hochberg method. ***, P < 0.001. (C) Frequency of IL5+, IL13+, and IL4+ cells in memory CD4+ T cells of one representative patient, along with one representative healthy control. (D) Quantification of C showing IL5+, IL13+, and IL4+ cells in patients along with 15 age-matched healthy controls. **, P < 0.01; ***, P < 0.001. (E) Uniform manifold approximation and projection (UMAP) visualization of scRNAseq done on enriched T cells comparing one patient with one age-matched healthy control. (F) Dot plot showing expression of selected differentially expressed genes (adjusted P value < 0.05) observed in scRNAseq between patient and healthy control and associated with T cells, B cells, monocytes, or dendritic cells.

