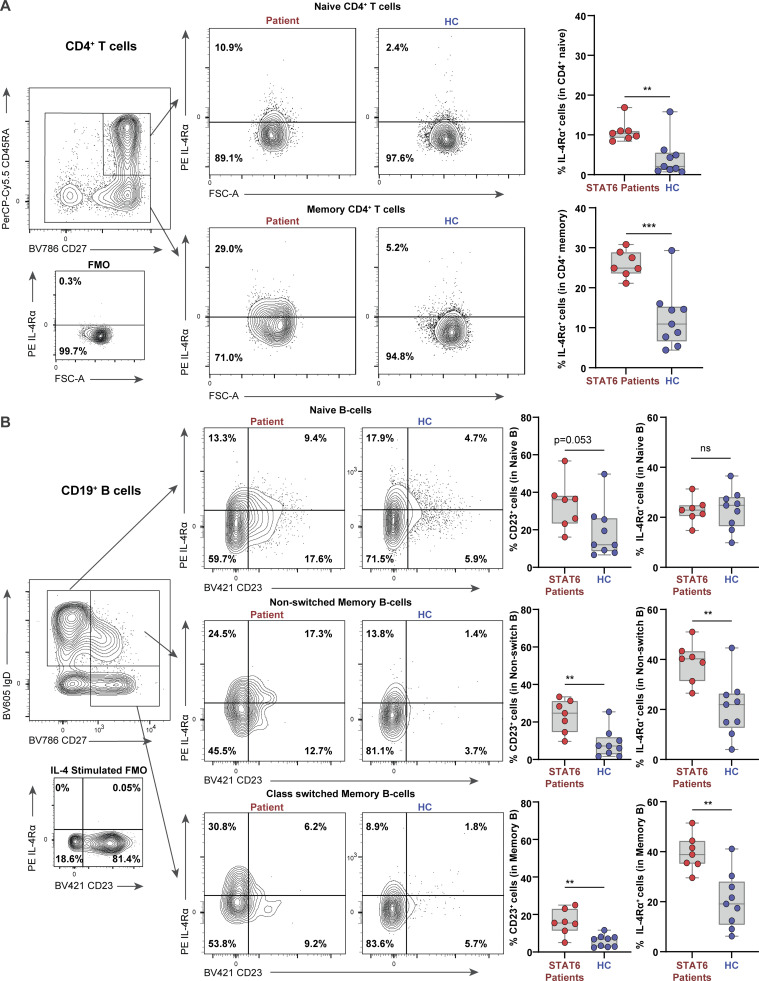
Figure 5.
Primary lymphocytes of STAT6 GOF patients display high expression of STAT6 target genes. (A) Expression of IL4Rα in naive and memory CD4+ cells is quantified as % positive cells in primary patient cells (n = 7, red) and healthy controls (n = 9, blue). Gating strategy for naive and memory and CD4+ is presented along with a dot plot for a fluoresence minus one (FMO) IL-4Rα sample to display IL-4Rα+ gating, as well as a representative dot plot for a patient and healthy control. (B) Expression of CD23 and IL4Ra in naive, non-class switched memory and memory B cells is quantified as % positive cells in primary patient cells (n = 7, red) and healthy controls (n = 9, blue). Gating strategy for B cell subsets is presented along with a dot plot for an FMO IL-4Rα sample to display IL-4Rα+ gating, as well as a representative dot plot for a patient and healthy control. Unpaired t test. **, P < 0.01; ***, P < 0.001.

