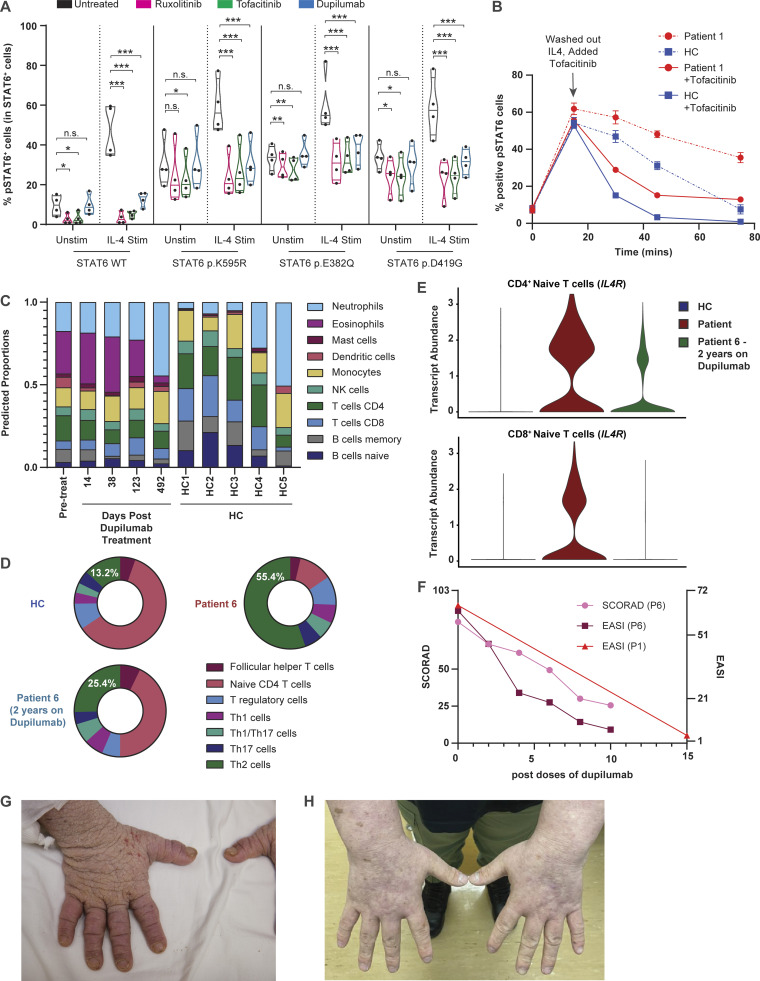
Figure 6.
JAK inhibitors and IL-4Rα antibody can be used as potential therapeutics for patients with GOF STAT6 variants. (A) Quantification of phospho-STAT6 expression in transfected HEK293 cells left untreated (black) pre-treated with ruxolitinib (10 μM, 1 h; pink), tofacitinib (10 μM, 1 h; green), or dupilumab (10 nM, 1 h; blue), before and after stimulation with IL-4 (10 ng/ml, 30 min). Individual points represent separate transfections for each genotype (n = 4). Gating strategy for pSTAT6+ cells can be found in Fig. S3 C. One-way ANOVA and Tukey’s post-hoc test. *, P < 0.05; **, P < 0.01; ***, P < 0.001. (B) Quantification of pSTAT6+ cells in patient (red) and healthy control (blue) LCLs stimulated with IL-4 (10 ng/ml for 15 min), washed and incubated in tofacitinib (10 μM) for 15, 30, and 60 min. Dotted translucent lines are indicative of no tofacitinib treatment (Fig. 4 B); n = 1. Gating strategy for pSTAT6+ cells can be found in Fig. S4 C. (C) Cell type proportion gene signature as determined by the software Cibersort, in a patient undergoing dupilumab treatment for 2 yr and five healthy controls. Cell labels are listed on the right. (D) Donut plot showing frequencies of CD4+ T helper subsets in one patient, an age-matched healthy control (Fig. 4 E), and a 2-yr post-dupilumab treatment patient sample as measured by scRNAseq on enriched T cells. Frequency of TH2 cells is quantified in the donut plots of the different samples. (E) Violin plots showing expression of IL4R in the patient (red), healthy control (blue), and a 2-yr post-dupilumab sample (green). (F) Eczema scoring, EASI and SCORAD, for two patients after treatment with multiple doses of dupilumab. (G and H) Photographs of hands showing (G) the severity of atopic dermatitis before and (H) the improvement after dupilumab treatment.

