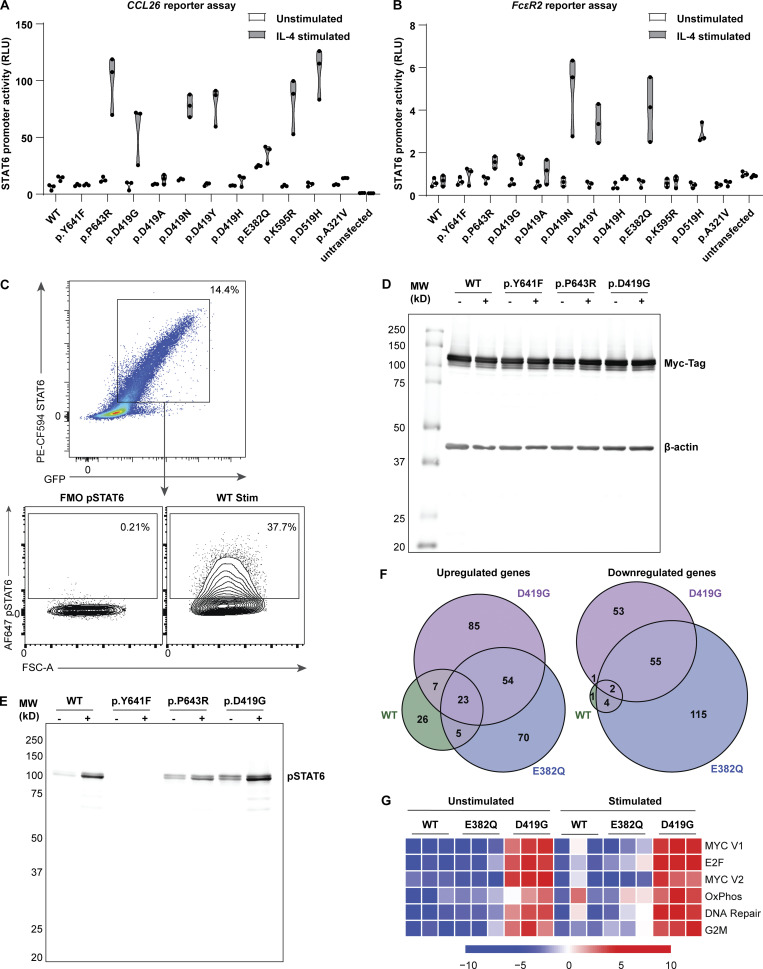
Figure S3.
In vitro assays demonstrate that STAT6 variants lead to increased STAT6 activity. (A and B) Luciferase assay of STAT6 activity on a plasmid containing (A) CCL26 promoter and (B) FcεR2 promoter for WT-, different STAT6-variant transfected HEK293 cells before and after stimulation with IL-4 (100 ng/ml for 40 h), n = 3. (C) Gating strategy for determining % positive HEK293 pSTAT6 cells: dot plot for fluoresence minus one (FMO) is presented and was used for establishing pSTAT6+ cells. (D and E) Full-length immunoblots of the cropped immunoblots shown in Fig. 3 E, showing HEK293 cells transfected with WT-, inactive- (p.Y641F), p.P643R-, and p.D419G- STAT6 variants for (D) Myc-tag and β-actin, as well as (E) pSTAT6 before and after treatment with IL-4 (10 ng/ml for 30 min). (F) Significantly upregulated (i) and downregulated (ii) genes upon IL-4 treatment in WT (green), p.E382Q (blue), and p.D419G (purple) in Jurkat cells as shown through Venn diagram. (G) Sample level enrichment analyses of significantly enriched immune pathways from MSigDB Hallmark in unstimulated and IL-4–stimulated samples, comparing WT vs. either p.E382Q or p.D419G. Heatmap is normalized across the rows and shown as relative expression.

