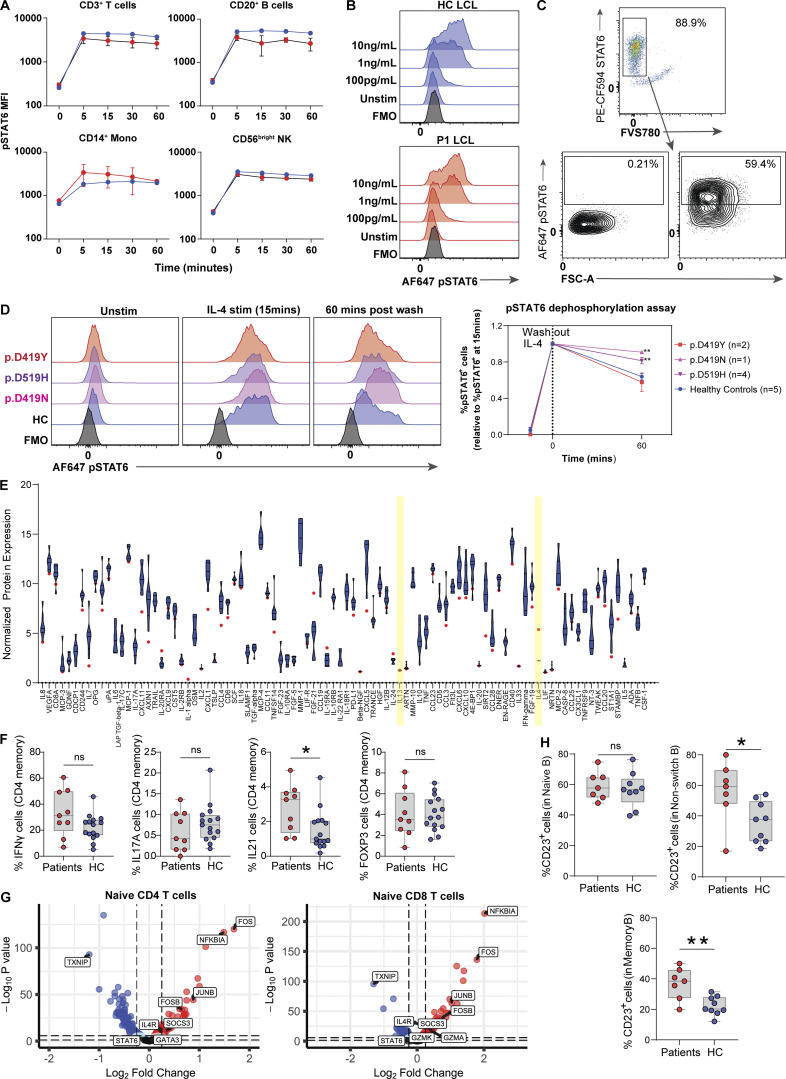
Figure S4.
Measure of STAT6 activity in patient primary lymphocytes. (A) 1-h time course to measure phosphorylation of STAT6 in different populations of lymphocytes from five patients (red) and one healthy control (blue) after stimulation with IL-4 (10 ng/ml). (B) Dose response in LCLs of patient one (red) vs. one healthy control (blue) after stimulation of cells with various doses of IL-4 15 min. (C) Gating strategy to determine % pSTAT6 positive cells in LCLs: dot plot for FMO is presented and was used for establishing pSTAT6+ cells. (D) Histograms showing phosphorylation of STAT6 in healthy control (blue) and patients with genotype p.D419Y (red, n = 2), p.D519H (purple, n = 4), p.D419N (pink, n = 1), and healthy controls (blue, n = 5) in T cell blasts that were stimulated with IL-4 (10 ng/ml) for 15 min, washed with PBS, and subsequently incubated in IL-4–free media for 60 min. Quantification of pSTAT6+ cells is presented and normalized to max stimulation (noted at 15 min). Two-way ANOVA followed by Šídák’s multiple comparisons was conducted. **, P < 0.01. (E) Readout of 92 biomarkers for P5 using throughput Olink proteomics. Eight healthy control distribution are shown as a violin plot in blue. The patient is shown as a red circle. Key cytokines, IL-4 and IL-13, are highlighted in yellow. (F) T helper cell distribution for nine patients (red) and 15 age-matched healthy controls (blue) each. (G) Transcriptomic comparison of naive CD4+ and naive CD8+ T cells between P6 and one healthy control measured through scRNAseq. Red genes are enriched in patient; blue genes are enriched in healthy control. The two dotted lines are the P value and adjusted P value respectively. (H) Quantification of % CD23 positive cells in naive, non-class switched memory, and class-switched memory B cells between patients (red, n = 7) and healthy controls (blue, n = 9) after stimulation with IL-4 (10 ng/ml) for 20 h. Unpaired t test. *, P < 0.05; **, P < 0.01.

