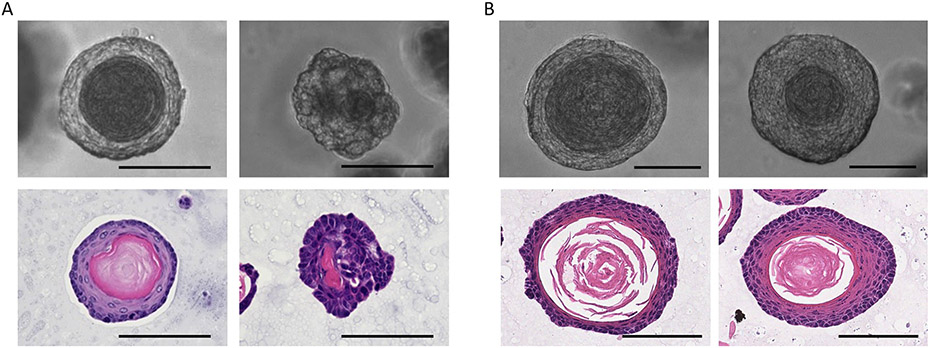
Figure 6: Characterizing the organoids by morphological analysis.
Panel A: Representative images of normal and ESCC MEOs. Upper left: Brightfield image of a normal MEO. Lower left: H&E staining of a normal MEO. Upper right: Brightfield image of an ESCC MEO from a 4NQO-treated mouse. Lower right: H&E staining of an ESCC MEO from a 4NQO-treated mouse displaying nuclear atypia and abrupt keratinization, the latter being reminiscent of a keratin pearl, representing a well-differentiated compartment within an SCC tumor. Panel B: Representative images of normal mouse tongue and forestomach organoids (MTO and MFO, respectively). Upper left: Brightfield image of a normal MTO. Lower left: H&E staining of a normal MTO. Upper right: Brightfield image of a normal MFO. Lower right: H&E staining of a normal MFO. All scale bars = 100 μm.

