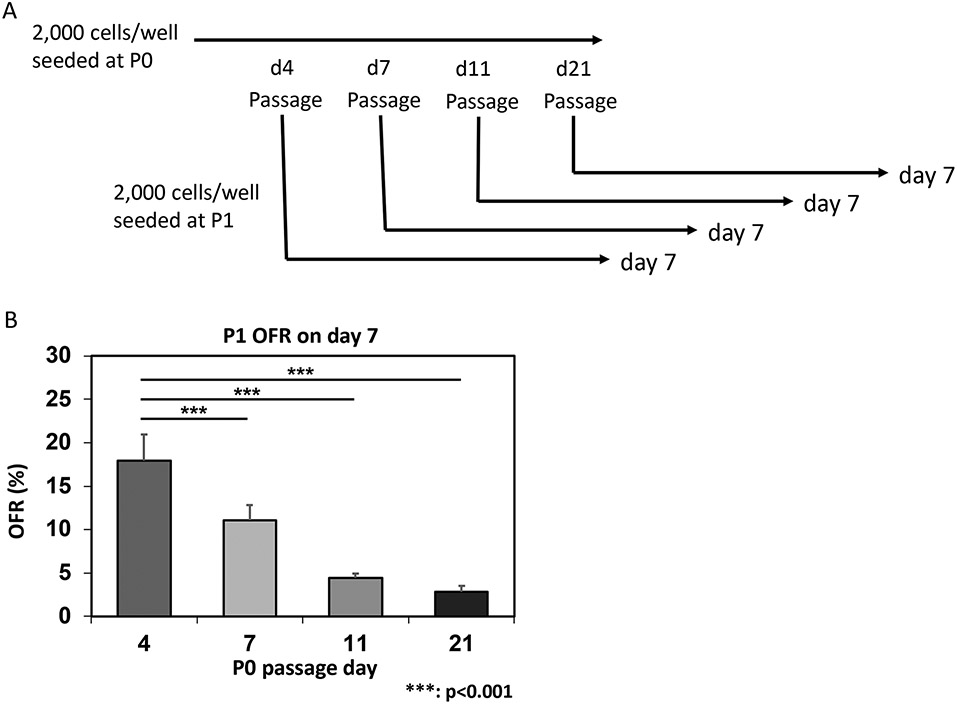
Figure 7: Determining organoid renewal capacity.
Panel A: Experimental design to determine the organoid renewal capacity by subculture. The growing primary organoids (P0) are dissociated at various time points and made into single-cell suspensions. These cells are passaged to determine the OFR at day 7 in the subculture (P1). Panel B: Representative OFR data from passaged MTOs generated from 4NQO-untreated mice. Note that the OFR decreases as a function of time, reflecting decreased proliferative basaloid cells in the matured organoids, which contain more cells that have undergone post-mitotic terminal differentiation (see Figure 8). *** p < 0.001 (n = 6) OFR at day 7, day 11, and day 21 versus OFR at day 4.

