Figure 1.
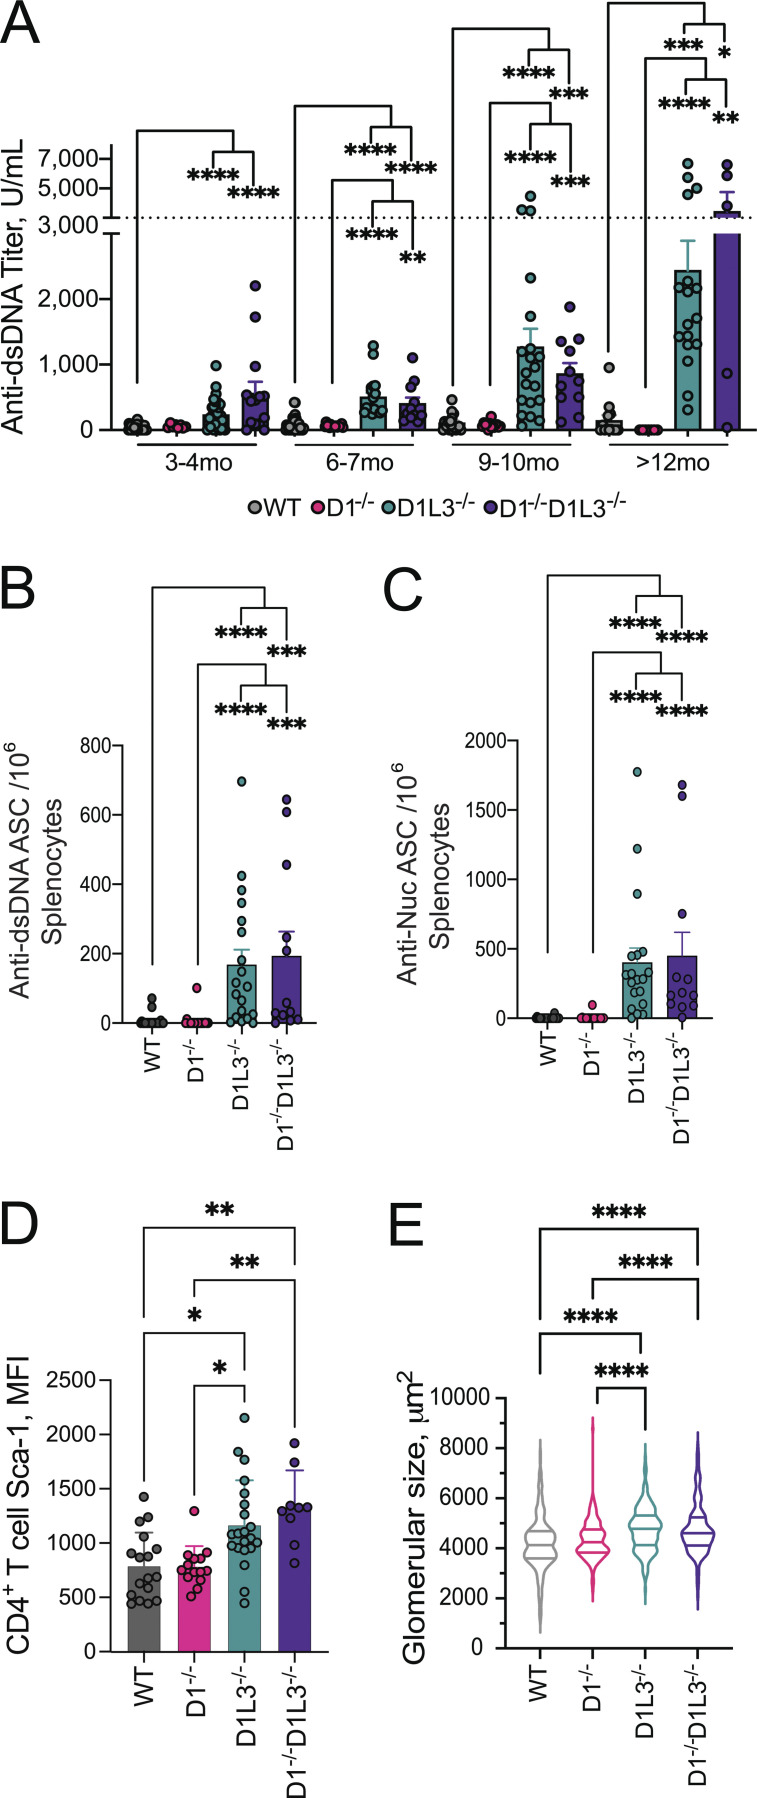
DNASE1 deficiency does not cause or exacerbate autoreactivity to DNA. (A) Serum titers of auto-Abs to dsDNA as determined by ELISA. Symbols represent individual mice; bars represent mean ± SEM. Groups of WT, D1−/−, D1L3−/−, and D1−/−D1L3−/− mice were assessed at 3–4 mo (n = 33; 8; 36; 14), 6–7 mo (n = 33; 17; 19; 11), 9–10 mo (n = 17; 14; 20; 11), and >12 mo (n = 13; 7; 17; 5). (B and C) WT (n = 23), D1−/− (n = 19), D1L3−/− (n = 19), and D1−/−D1L3−/− (n = 12) mice were assessed at 1 yr of age by ELISpot for the frequency of splenic antibody-secreting cells (ASC) reactive to dsDNA (B) and nucleosomes (C). Symbols represent individual mice; bars represent mean ± SEM. (D) CD4+ T cells from the spleens of 1-yr-old WT (n = 17), D1−/− (n = 14), D1L3−/− (n = 21), and D1−/−D1L3−/− (n = 9) mice were assessed for the expression of Sca-1 by flow cytometry. Symbols represent individual mice; bars represent mean ± SEM. (E) The sizes of glomeruli in the kidneys of mice of indicated genotypes at 1 yr of age. Shown are violin plots with median (thick lines) and quartiles (thin lines). At least 50 glomeruli from a single kidney section from WT (n = 6), D1−/− (n = 6), D1L3−/− (n = 6), and D1−/−D1L3−/− (n = 6) mice were measured. Statistical significance was determined by Kruskal–Wallis test followed by Dunn’s multiple-comparison test except for E, where one-way ANOVA followed by Tukey’s multiple comparison was used; two-tailed P values < 0.05 (*), <0.01 (**), 0.001 (***), and <0.0001 (****). Only statistically significant differences are indicated in all panels.

