Figure 2.
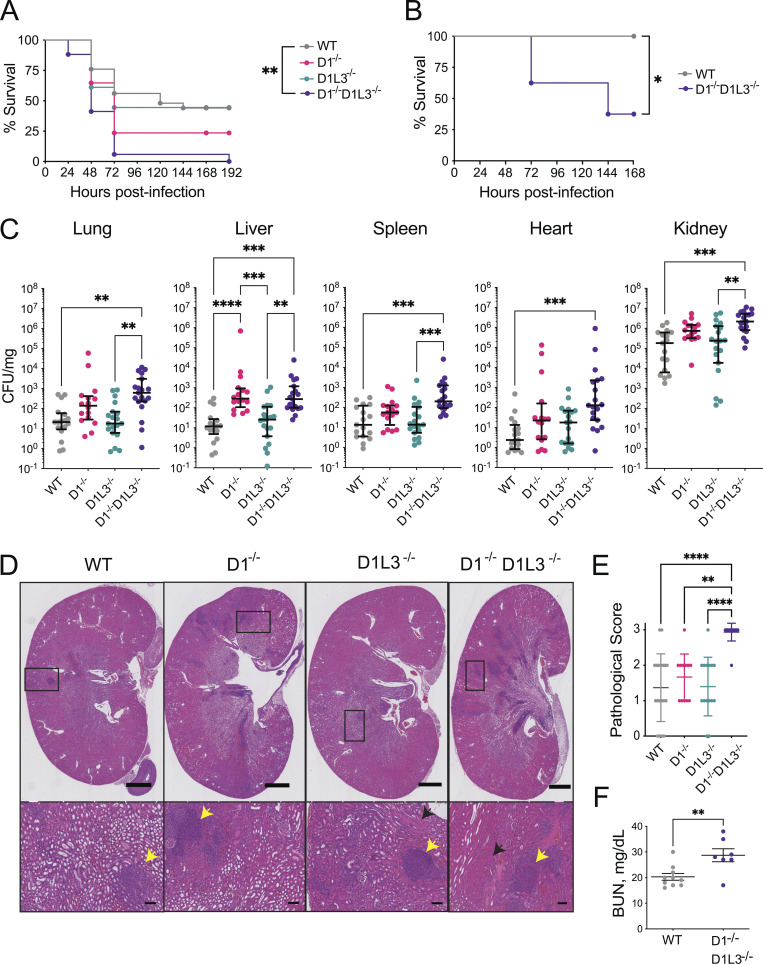
Deficiency of DNASE1 and DNASE1L3 impairs control of systemic S. aureus infection. (A) Survival of mice of indicated genotypes that were infected i.v. with 1 × 10⁷ CFU of S. aureus (n = 17–25 mice per group, pooled from three separate experiments). (B) Survival of mice of indicated genotypes that were infected i.v. with 7.5 × 10⁶ CFU of S. aureus (n = 7–8 mice per group). (C) Bacterial burden in the indicated organs of mice infected as in A and sacrificed 72 h later. Symbols represent individual mice; bars represent the median ± interquartile range of 16–19 mice per group; data are shown on a log scale. (D and E) Kidney pathology in the infected mice 72 h after infection. (D) H&E-stained sections of kidneys (representative of at least 12 mice per group). Scale bars, 1 mm (whole kidney) and 100 μm (magnified image). Arrows indicate areas of immune cell infiltration (yellow) and tissue necrosis (black). (E) Pathological scoring for the kidneys from indicated genotypes. Symbols represent individual mice; bars represent mean ± SD of 12–19 mice per group. (F) Blood urea nitrogen (BUN) in the blood of infected mice 72 h after infection. Symbols represent individual mice, bars represent mean ± SD of 7–10 mice per group. Statistical significance between groups was determined by log-rank (Mantel–Cox) test (A and B) using Bonferroni correction for multiple comparisons where appropriate (A), Kruskal–Wallis test followed by the Dunn’s multiple-comparison test (C and E), or Student’s t test (F). Two-tailed P values <0.01 (**), <0.001 (***), and <0.0001 (****); Bonferroni corrected two-tailed P value <0.017 (**). Only significant differences are indicated in all panels.

