Figure 8.
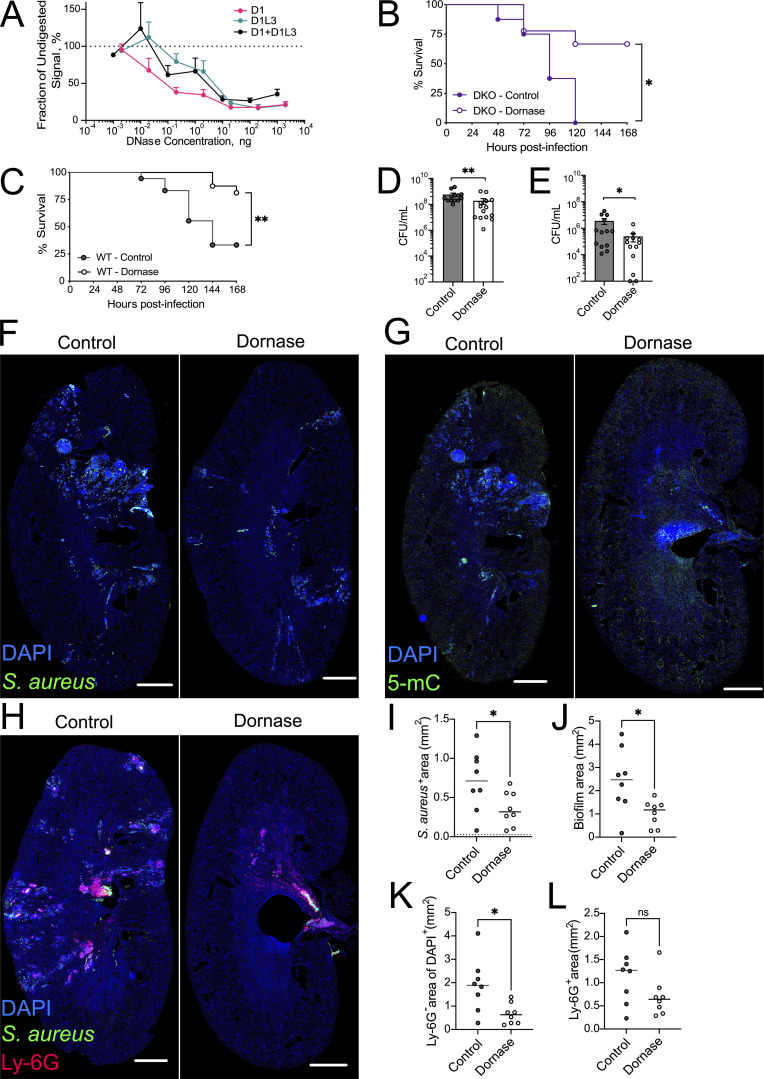
Treatment with DNASE1 ameliorates S. aureus infection in vivo. (A) Dispersal of biofilms by recombinant DNases. S. aureus biofilms were grown and digested in vitro with a concentration range of recombinant DNASE1 and DNASE1L3, and the remaining biofilm was quantified. The OD values from each experiment were normalized to the undigested OD value from that experiment and plotted as a fraction of the undigested signal; bars represent mean ± SEM. (B–E) Mice were infected i.v. with 1 × 10⁷ CFU S. aureus and treated with Dornase or with buffer only (control) at 4, 24, 48, 72, and 96 h after infection. Mice were sacrificed at 30% weight loss for humane endpoint. (B) Survival of D1−/−D1L3−/− DKO mice (n = 8–9 per group). (C) Survival of WT mice (n = 16–18 per group). (D and E) Bacterial burden in the kidney (D) and liver (E) of infected Dornase- or buffer-treated WT mice 96 h after infection. Symbols represent individual mice; bars represent mean ± SEM. (F–L) WT mice were infected i.v. with 1 × 10⁷ CFU S. aureus and treated with Dornase or with buffer only (control) at 4, 24, and 48 h after infection, and their kidneys were examined by immunohistochemistry 72 h after infection. (F–H) Representative images of whole kidney sections stained with DAPI and antibodies to S. aureus (F), 5-mC (G), and S. aureus plus Ly-6G (H). Scale bar, 1 mm. (I–L) Quantification of S. aureus–positive area (I), DAPI-positive 5-mC–negative biofilm area (J), Ly-6G–negative area within DAPI-positive lesions (K), and total Ly-6G–positive area (L) per kidney. Symbols represent individual mice; bars represent the median. The dotted line in I represents the mean value of uninfected WT mice. Statistical significance between groups was determined by log-rank (Mantel–Cox) test (B and C) and Mann–Whitney test in other panels. Two-tailed P values <0.05 (*) and <0.01 (**); ns, not significant.

