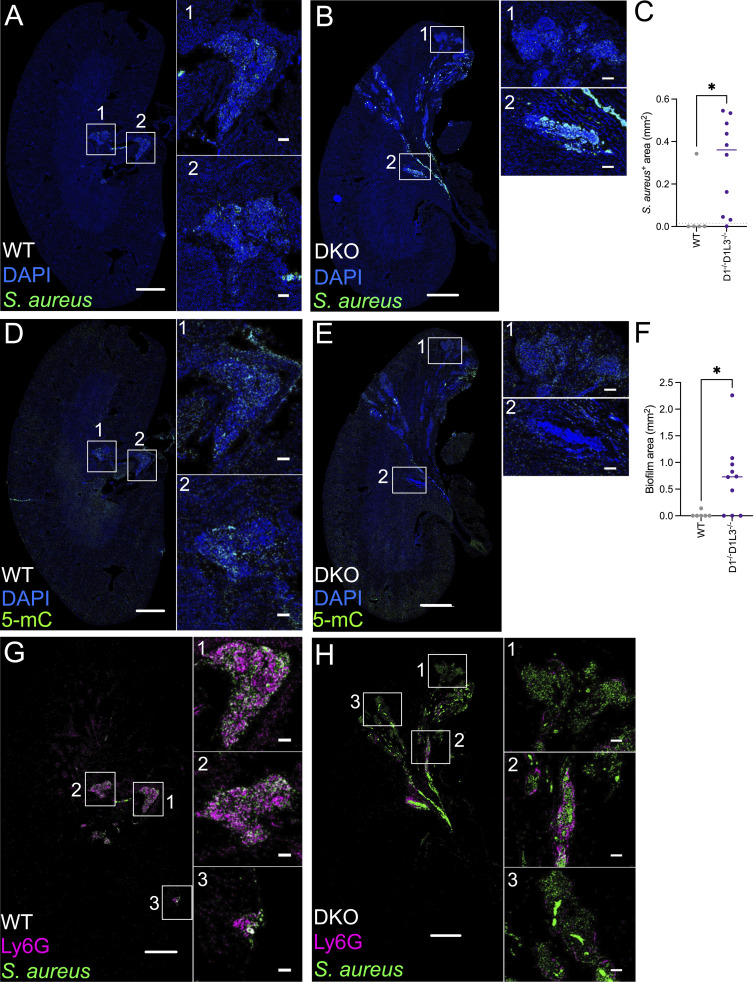
Figure S5.
Biofilm formation in the kidneys at 48 h after infection with S. aureus. WT or D1−/−D1L3−/− DKO mice were infected i.v. with 1 × 10⁷ CFU of S. aureus, and their kidneys were examined by immunohistochemistry 48 h later. (A and B) Kidney sections from infected WT (A) and DKO (B) mice stained with anti–S. aureus antibody and DAPI. Shown are low-magnification images of the entire kidney (scale bar, 1 mm) and magnified images of areas in white boxes (scale bar, 100 μm). (C) Quantification of S. aureus–positive area in kidney sections. Symbols represent individual mice; bars represent median. The dotted line represents the mean value of uninfected WT mice. (D and E) Kidney sections of WT (D) and DKO (E) mice stained with DAPI and 5-mC. Each panel includes low-magnification images of the entire kidney (scale bar, 1 mm) and magnified images of areas in white boxes (scale bar, 100 μm). (F) Quantification of DAPI-positive 5-mC–negative biofilm area in kidney sections. Symbols represent individual mice; bars represent the median. Serial sections were taken from the same kidney for S. aureus and 5-mC staining. (G and H) Kidney sections from infected WT (G) and DKO (H) mice stained with antibodies to S. aureus and Ly-6G. Shown are low-magnification images of the entire kidney (scale bar, 1 mm) and magnified images of areas in white boxes (scale bars, 100 μm). Representative of three to four animals per group. Statistical significance was determined by Mann–Whitney test; two-tailed P values <0.05 (*).

