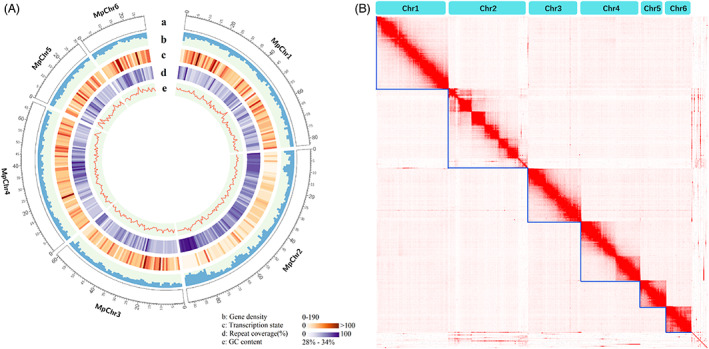
Figure 1.

Chromosome‐scale genome assembly of a tobacco‐adapted red Myzus persicae strain. (A) M. persicae genome landscape. (a) Ideogram of the 6 M. persicae pseudochromosomes at the Mb scale. (b) Gene density is represented as number of genes per Mb. (c) Transcription state. The transcription level was estimated by read counts per million mapped reads in 1‐Mb windows. (d) Percentage of coverage of repeat sequences per Mb. (e) Guanine‐cytosine (GC) content in 1‐Mb windows. (B) Heatmap showing the frequency of HiC contacts along the M. persicae genome assembly. Blue lines indicate chromosome‐scale scaffolds.
