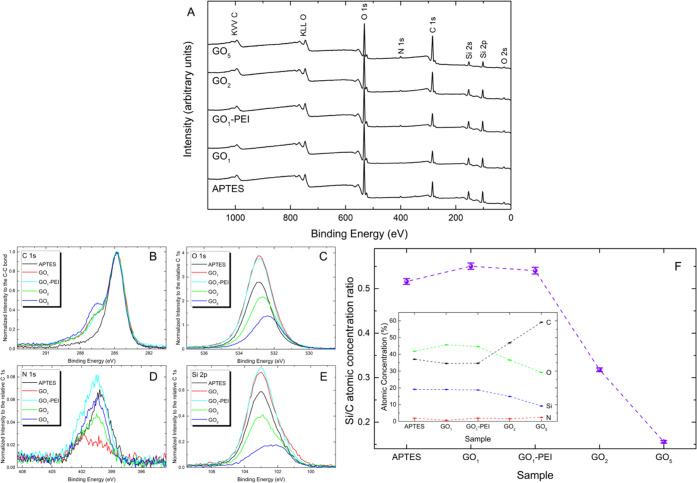
Figure 3.
(A) XPS survey spectra of APTES, GO1, GO1–PEI, GO2, and GO5 networks. Detailed XPS scans of (B) C 1s, (C) O 1s, (D) N 1s, and (E) Si 2p of APTES, GO1, GO1–PEI, GO2, and GO5 samples. (F) Atomic concentration Si/C ratio for APTES, GO1, GO1–PEI, GO2, and GO5 samples. Inset: atomic concentrations of the same samples.

