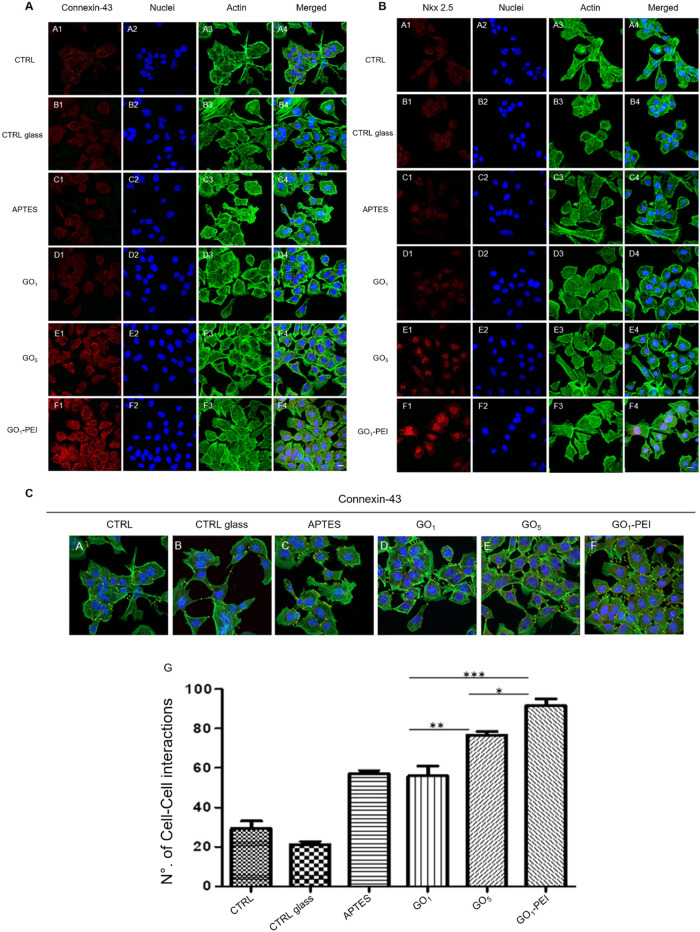
Figure 5.
Confocal microscopy images showing the expression of Connexin-43 (panel A) and the expression of Nkx 2.5 (panel B) in HL-1 cells in all culture conditions. (Panels A and B, A1–A4) Cells cultured on a plastic substrate (CTRL). (Panels A and B, B1–B4) Cells cultured on untreated glass coverslip (CTRL glass). (Panels A and B, C1–C4) Cells cultured on APTES-treated glass coverslip (APTES). (Panels A and B, D1–D4) Cells cultured on a glass coverslip treated with one layer of GO (GO1). (Panels A and B, E1–E4) Cells cultured on a glass coverslip treated with five layers of GO alternated with PEI (GO5). (Panels A and B, F1–F4) Cells cultured on a glass coverslip treated with one sheet of GO complexed with PEI (GO1–PEI). (Panel C, A–F) Gap-junction distribution in HL-1 cultured cells. The expression as intracellular contact was measured (yellow dots added on images reported in panel A, A4–F4) on CTRL (A), CTRL glass (B), APTES (C), GO1 (D), GO5 (E), and GO1–PEI (F) confocal microscopy images. Red fluorescence: Connexin-43 or Nkx 2.5, respectively; blue fluorescence: cell nuclei, green fluorescence: cytoskeleton actin. Mag: 20×. Scale bar = 20 μm. (Panels C, histogram G) The histogram shows the means of cell-to-cell interactions for each experimental point. *p < 0.01; **p < 0.001; ***p < 0.0001.

