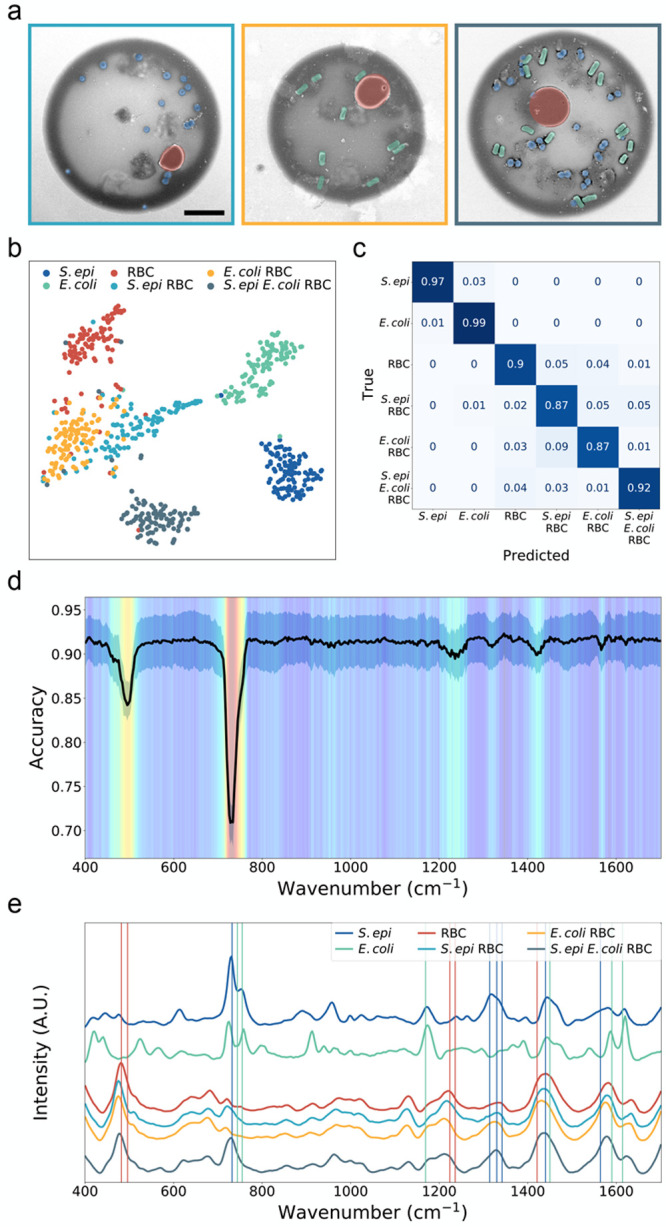
Figure 4.

(a) False-color SEMs of droplets printed from (left to right) an equal mixture of S. epi bacteria and RBCs, E. coli bacteria and RBCs, and S. epi, E. coli, and RBCs all diluted to 1e9 cells/mL in aqueous EDTA and mixed with GNRs. The scale bar is 5 μm. (b) 2-component t-SNE projection across all 600 Raman spectra acquired from 100 droplet measurements each, taken from single droplets printed from three cell lines (S. epi, E. coli, and RBCs) and three mixtures (S. epi and RBCs, E. coli and RBCs, and S. epi, E. coli, and RBCs) mixed with GNRs. Data are plotted after performing a 30-component PCA for dimensionality reduction. Plots show clustering of our cell lines with the most overlap between droplet mixture samples. (c) Normalized confusion matrix generated using a random forest classifier on the 600 spectra collected from single-cell-line droplets of S. epi, E. coli, and mouse RBCs mixed with GNRs and our 3 cell mixtures. Samples were evaluated by performing a stratified K-fold cross-validation of our classifier’s performance across 10 splits, showing ≥87% classification accuracy across all samples. (d) Heat map highlighting feature extraction performed to determine the relative weight of spectral wavenumbers in our random forest classification. The heat map is overlaid with a plot of the mean and standard deviation of the classification accuracy (black) calculated across all trials. Wavenumbers with lower accuracies are shown to be critical features, as random perturbations are highly correlated with decreases in classification accuracy. (e) Plots of the mean SERS spectra of 100 measurements each, taken from single droplets printed from three cell lines (S. epi, E. coli, and RBCs) and three mixtures (S. epi and RBCs, E. coli and RBCs, and S. epi, E. coli, and RBCs) mixed with GNRs. Wavenumbers attributed to biological peaks found in SERS spectra of S. epi, E. coli, and RBCs are plotted as blue, green, and red vertical lines, respectively. Peak assignments can be found in Supplementary Table 1.
