Figure 2.
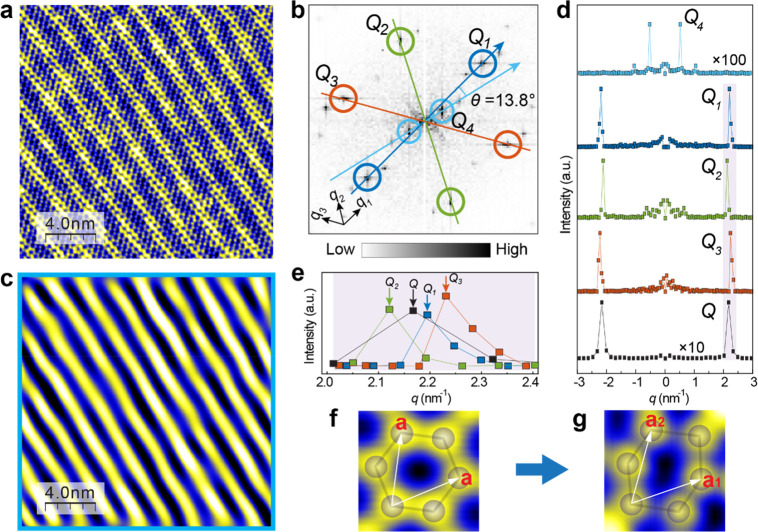
FFT analysis of the stripe modulations in strained FeSn/SrTiO3(111) films. a, STM topographic image of stripe modulations of Sn honeycomb lattice, set point: V = 100 mV, I = 5.0 nA. b, FFT of the image in (a). Bragg peaks along three directions q1, q2, and q3 are denoted by Q1, Q2, and Q3 in blue, green and red circles, respectively. The diffraction peak of the stripe modulation is denoted by Q4 in cyan circles. There is an angle of 13.8° between Q4 and Q1 directions. c, Reverse-FFT of the peak Q4 in (b). The distribution of the stripes coincides with the topography in (a). d, Line profiles along the Q1, Q2, Q3 and Q4 directions in (b). As a reference, the line profile across the Bragg lattice Q is obtained from the FFT of a perfect honeycomb lattice. e, Close-up view of the Bragg peaks Q1, Q2, Q3, and Q. The peak position is marked by arrows in corresponding colors. f, Perfect honeycomb with lattice vector a marked. g, Deformed honeycomb with lattice vectors a1 and a2 marked.

