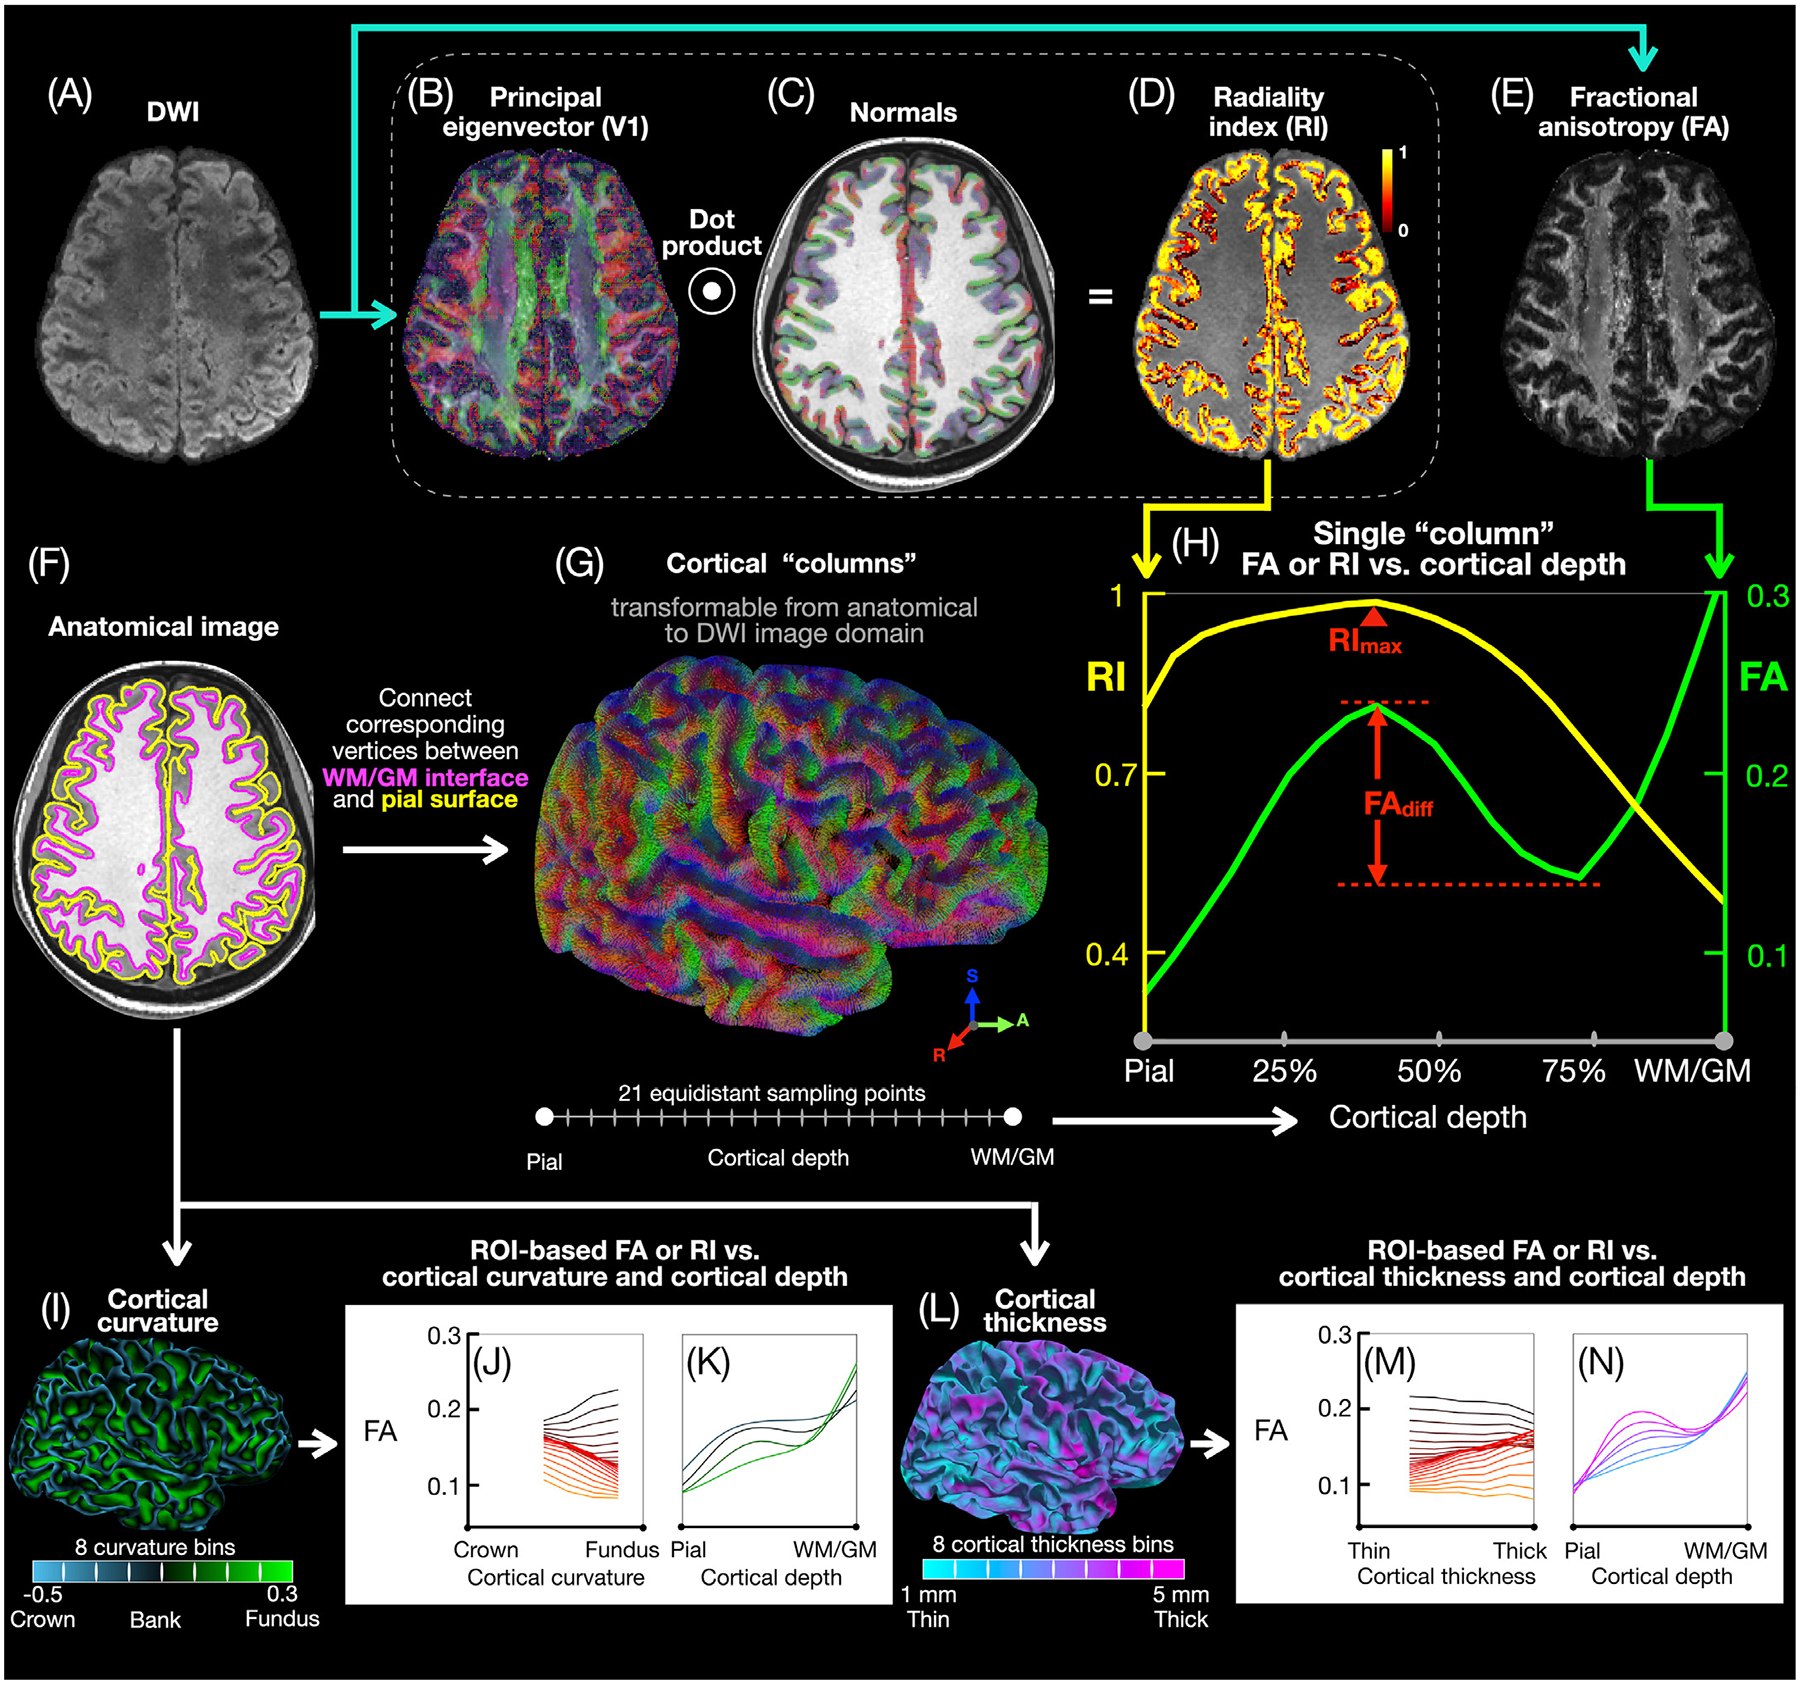
Fig. 2.

Cortical column-based and ROI-based analysis pipeline. After preprocessing, the DWI images (A) are used to derive V1 (B), RI (D), and FA (E) maps. The T1-weighted anatomical images are used to generate pial (yellow) and WM/GM (magenta) surface meshes (F) and normal vectors (C) to the WM/GM surface. Cortical “columns” (G) are generated by connecting corresponding vertices from the pial and WM/GM surface meshes, with 21 equidistant sampling points along each column, then transformed from the anatomical image domain to the DWI image domain to generate single-column FA and RI vs. cortical depth profiles (H), typically showing an FA local maximum and minimum (separated by FAdiff) and a single RI maximum (RImax). The cortical columns across all subjects are equally binned into 8 cortical curvature bins from the gyral crown to the sulcal fundus (I) or into 8 cortical thickness bins (L) to generate, in each ROI, FA and RI vs. cortical depth profiles for different curvature (K) or cortical thickness (N) bins as well as FA and RI vs. curvature (J) or cortical thickness (M) profiles for different cortical depths.
