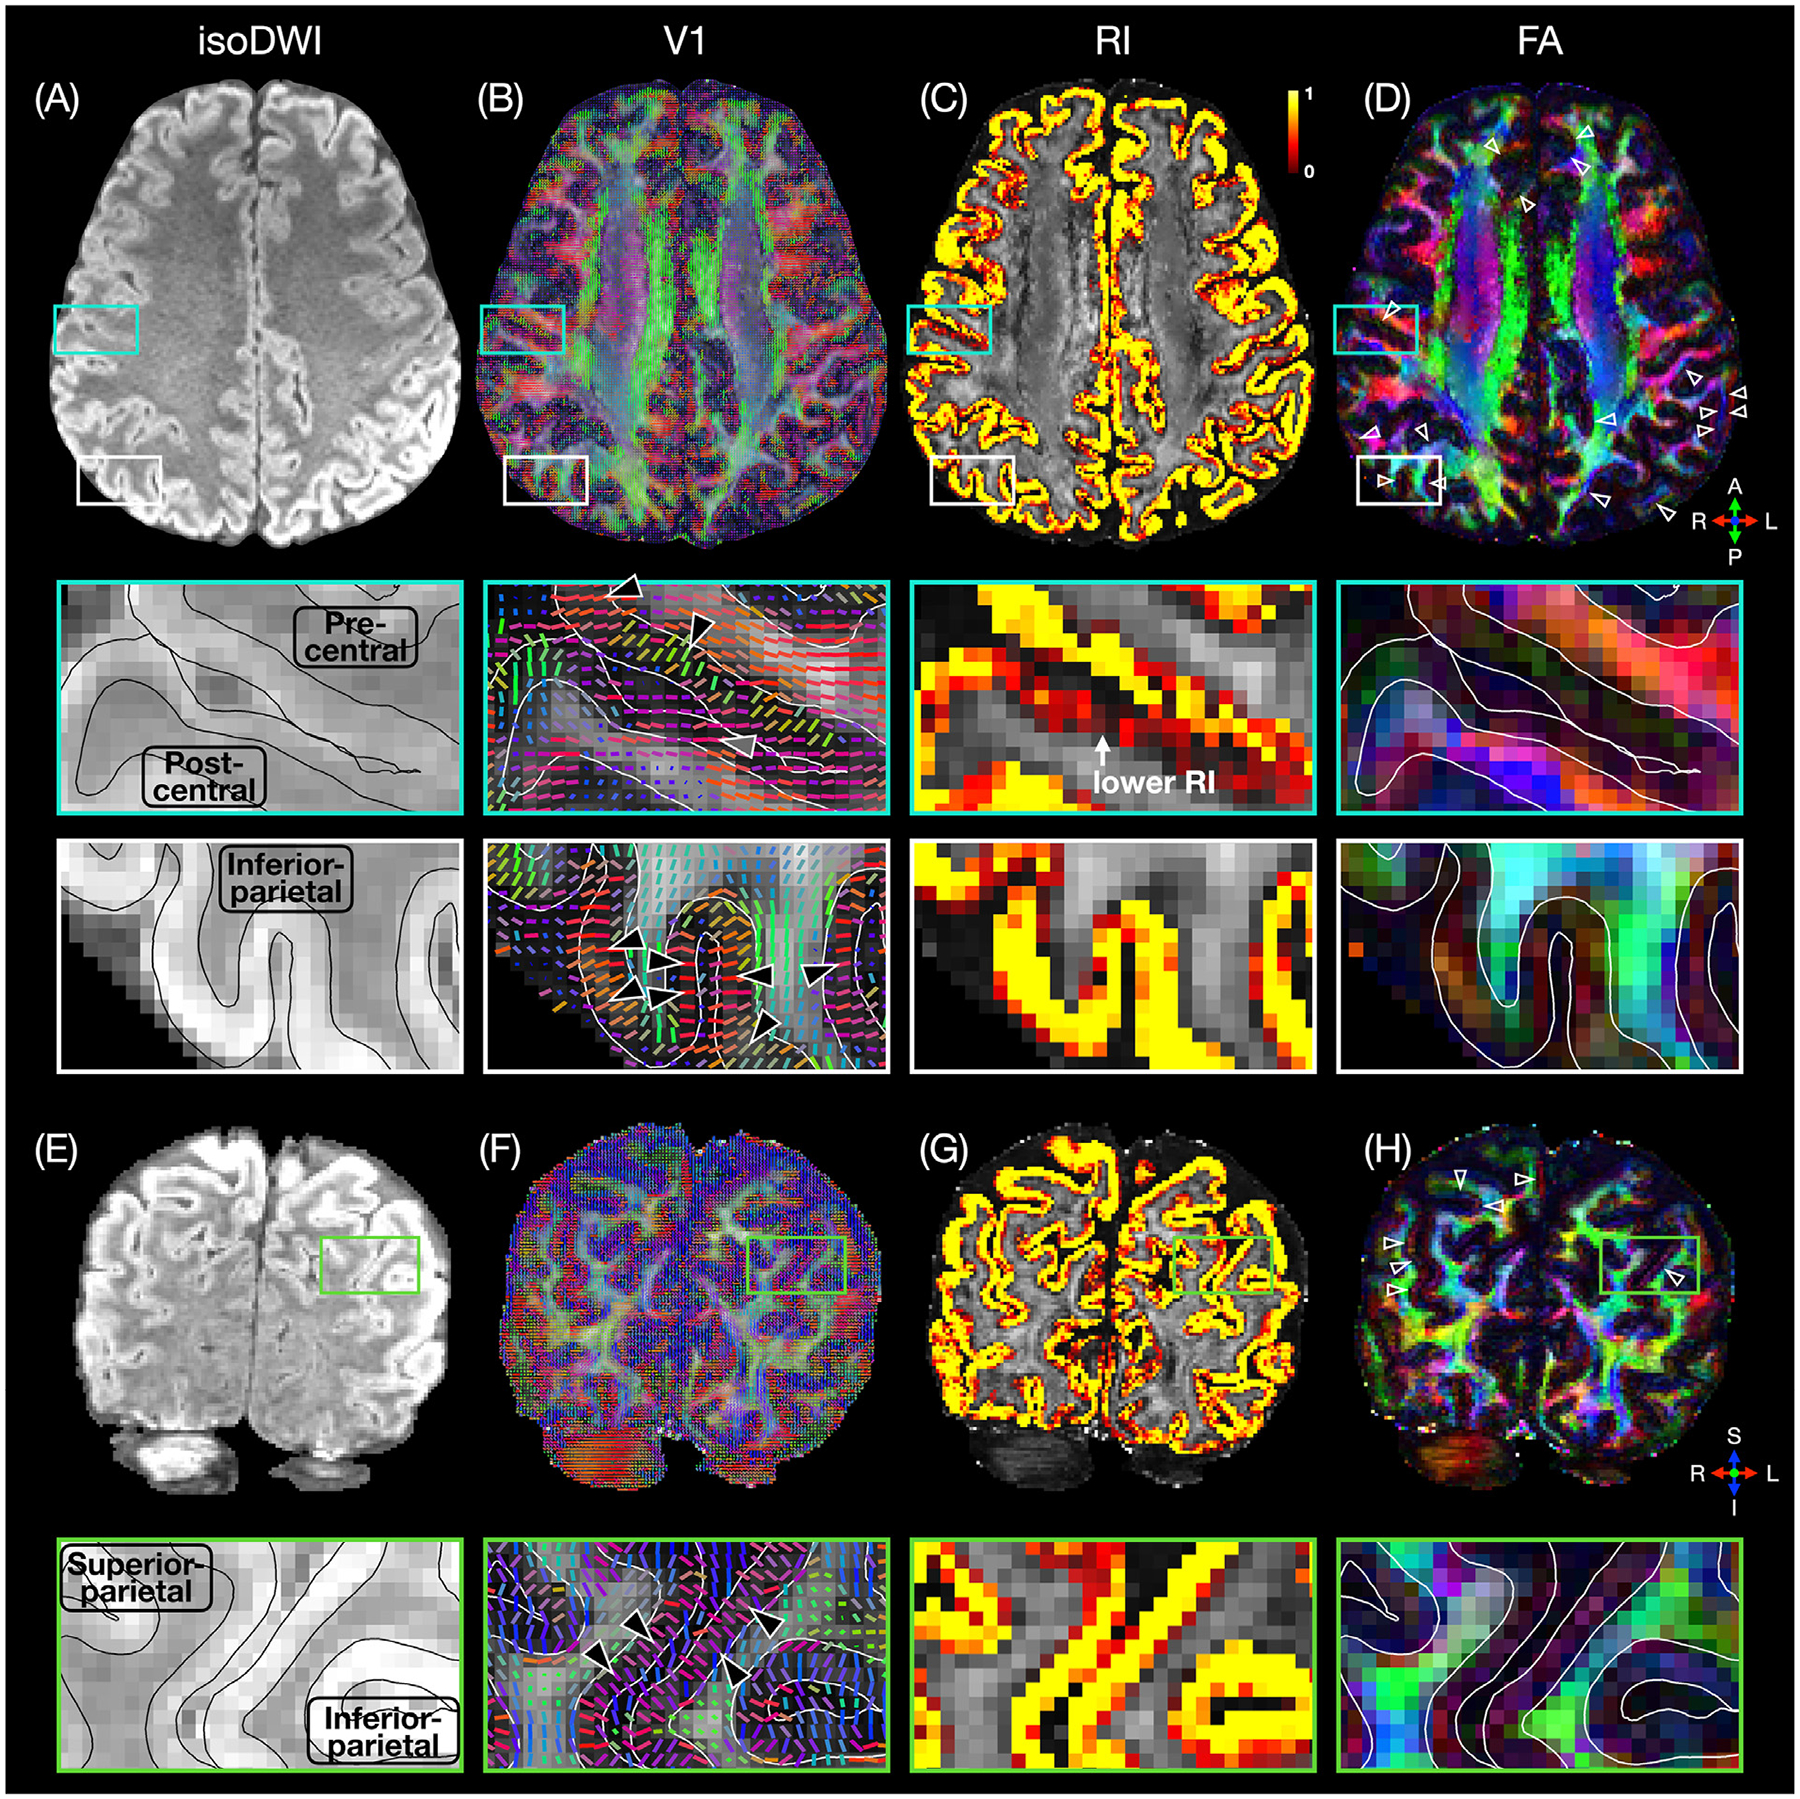
Fig. 3.

Axial and coronal isoDWI images (mean of all diffusion-weighted images; A,E), V1 maps (B,F), RI maps (C,G), and color-coded FA maps (D,H) from subject 3, showing a primarily radial diffusion orientation (black arrowheads in B,F), high RI values, and a band of low FA (open arrowheads in D,H) in most cortical regions, but a primarily tangential diffusion orientation (gray arrowhead in B), lower RI values, and no band of low FA in the postcentral gyrus. The black and white lines denote the pial surface and WM/GM interface derived from the registered T1-weighted anatomical images.
