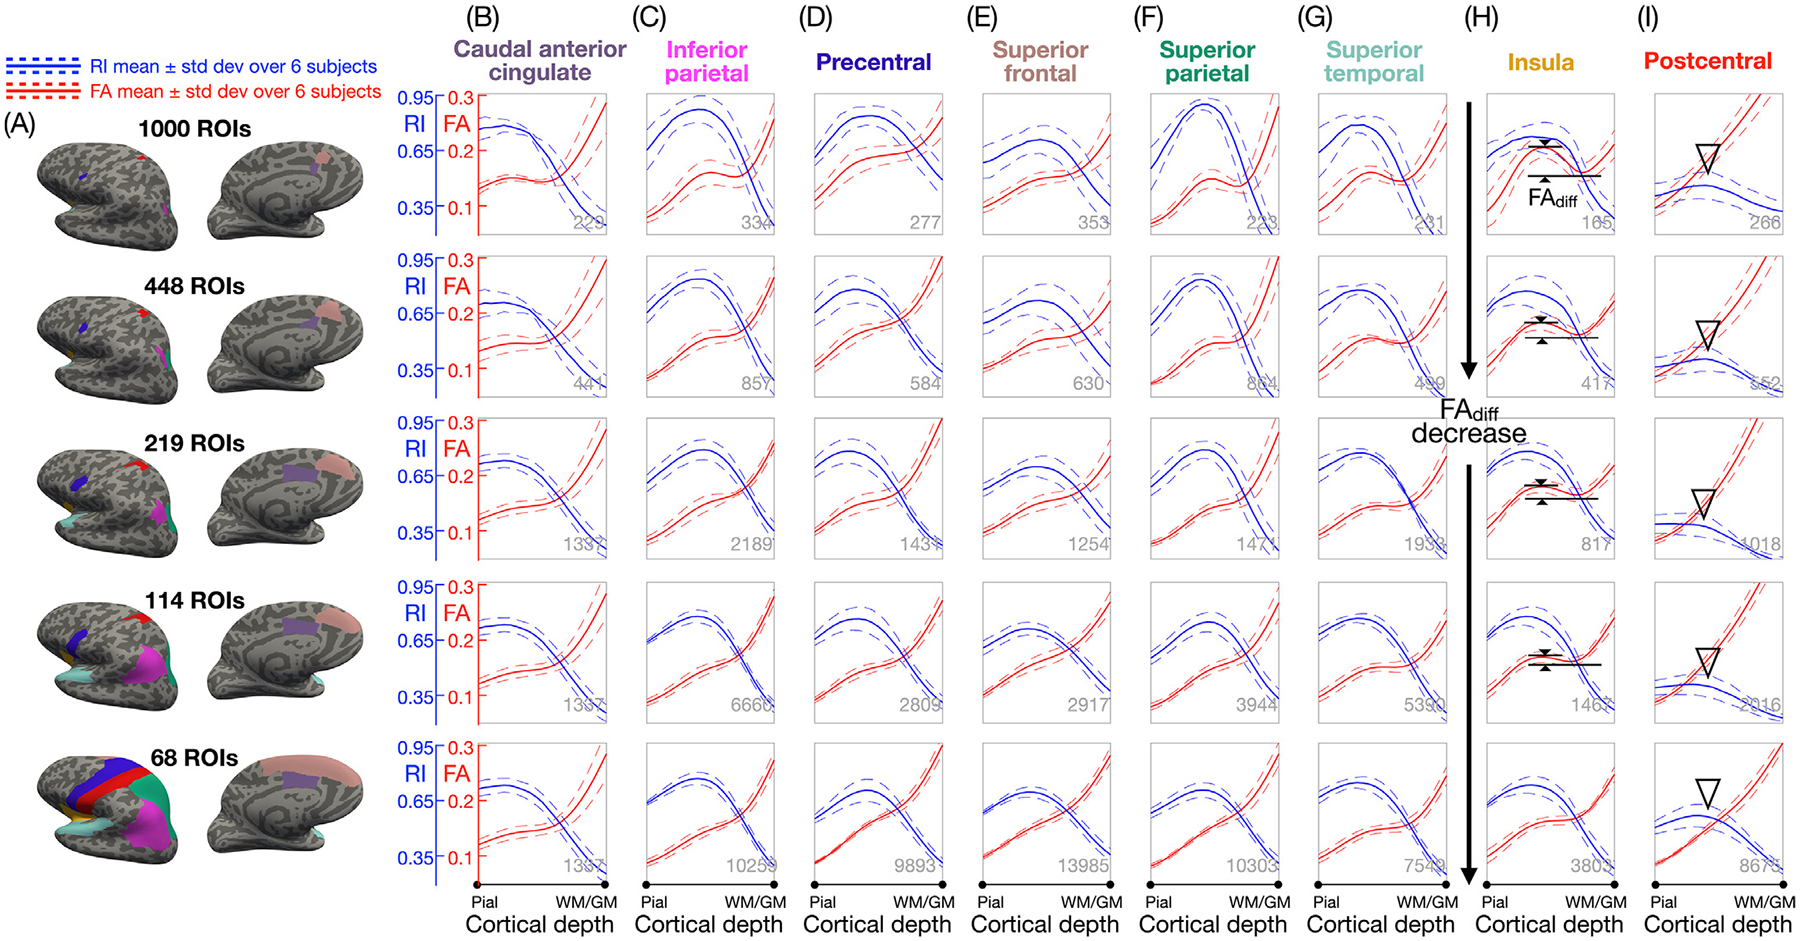
Fig. 4.

(A) 8 representative ROIs from each of the 5 atlases shown on inflated cortical surfaces, with the larger ROIs encapsulating the smaller ROIs sequentially. Note that the left and right hemispheres of the first four atlases are not symmetrical and that only results from the left hemisphere are displayed here. (B-I) Mean (solid lines) ± standard deviation (dashed lines) across the 6 subjects of the FA (red) and RI (blue) vs. cortical depth profiles in each of these ROIs, showing that FAdiff decreases as the ROI size increases (black arrows) and that there are no FA peaks and a lower RImax in the postcentral ROI (arrowheads). The number of cortical columns in each ROI (averaged over all 6 subjects) is shown at the bottom right corner of each plot.
