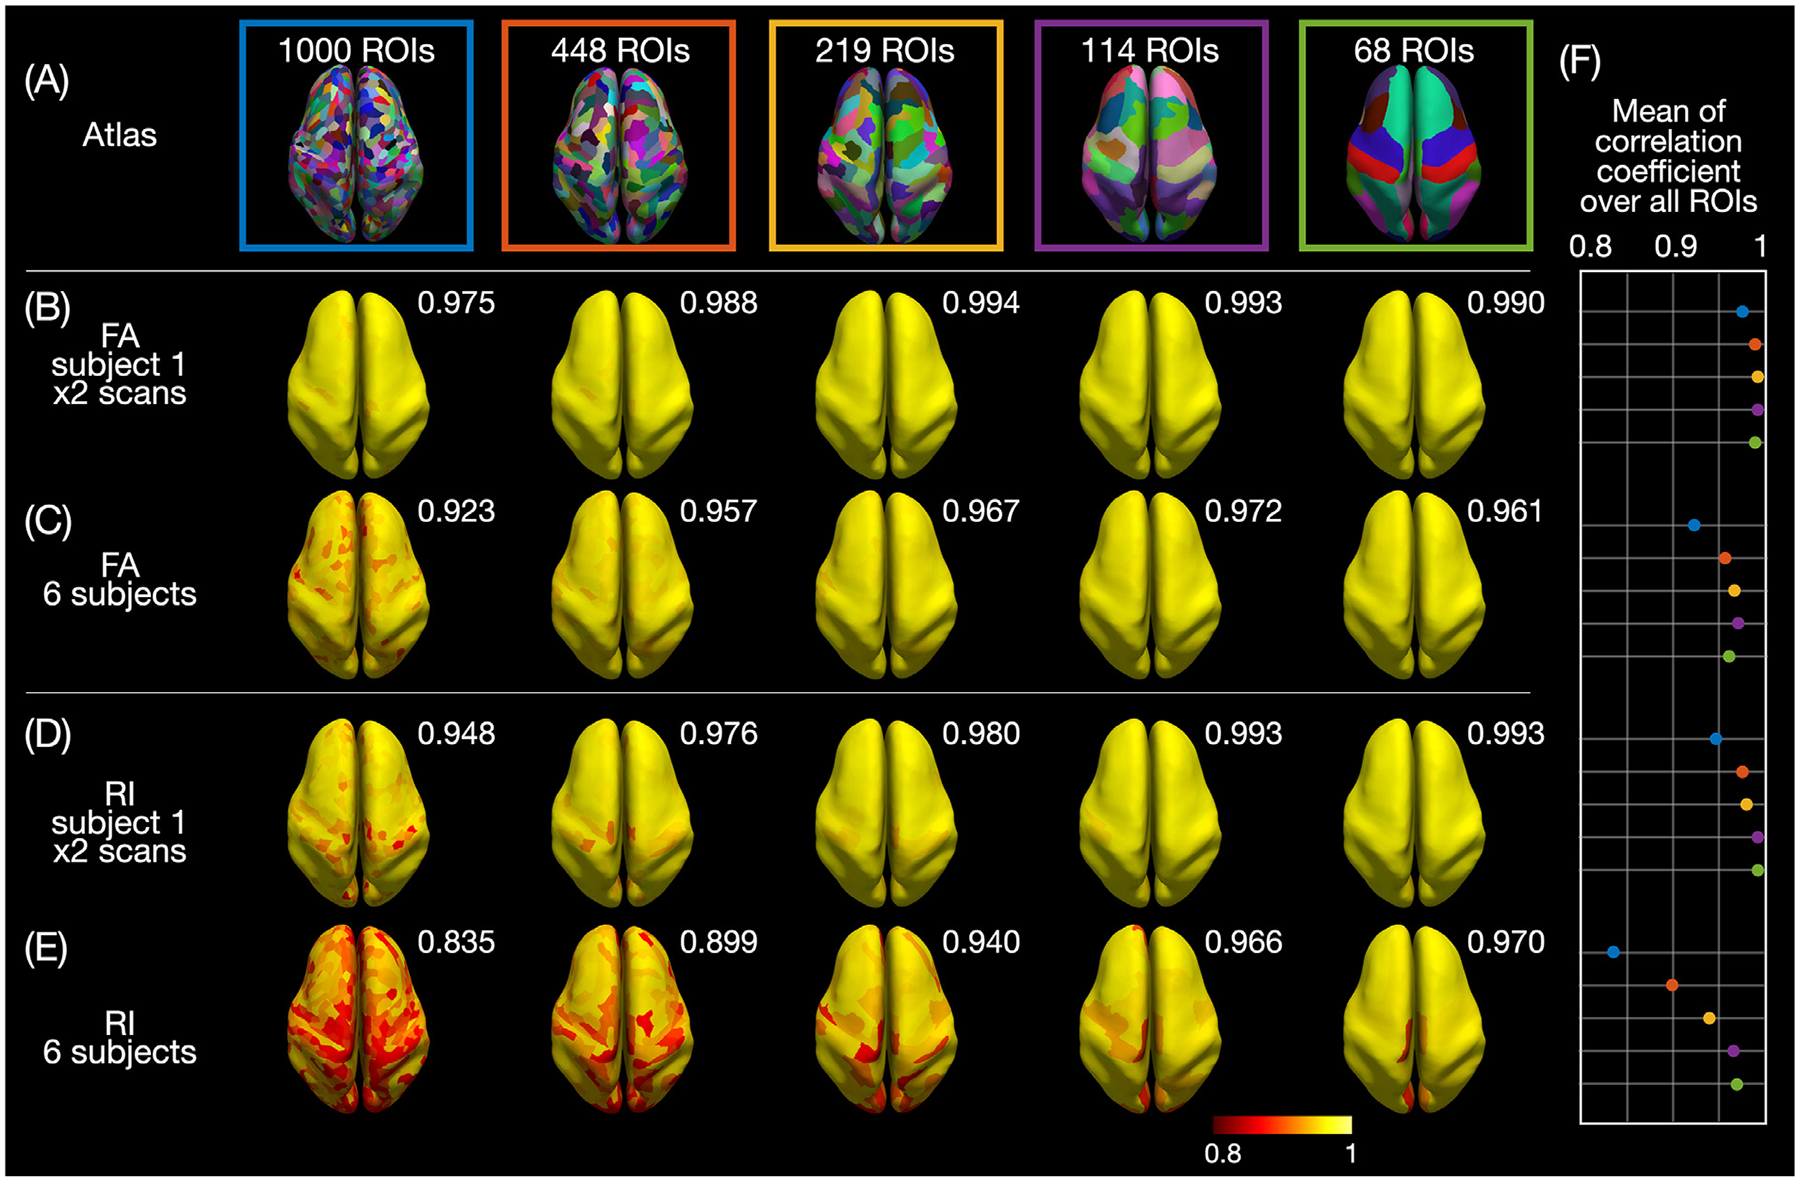
Fig. 5.

(A) ROIs from the 5 atlases displayed on the inflated cortical surface of subject 1. Correlation coefficient of the FA (B,C) or RI (D,E) vs. cortical depth profiles between both DTI scans of subject 1 (B,D) or across one DTI scan from each of the 6 subjects (C,E) calculated in each ROI and displayed on inflated cortical surfaces. (F) Plot of the mean correlation coefficients averaged over all ROIs (also shown at the top right corner of each brain).
