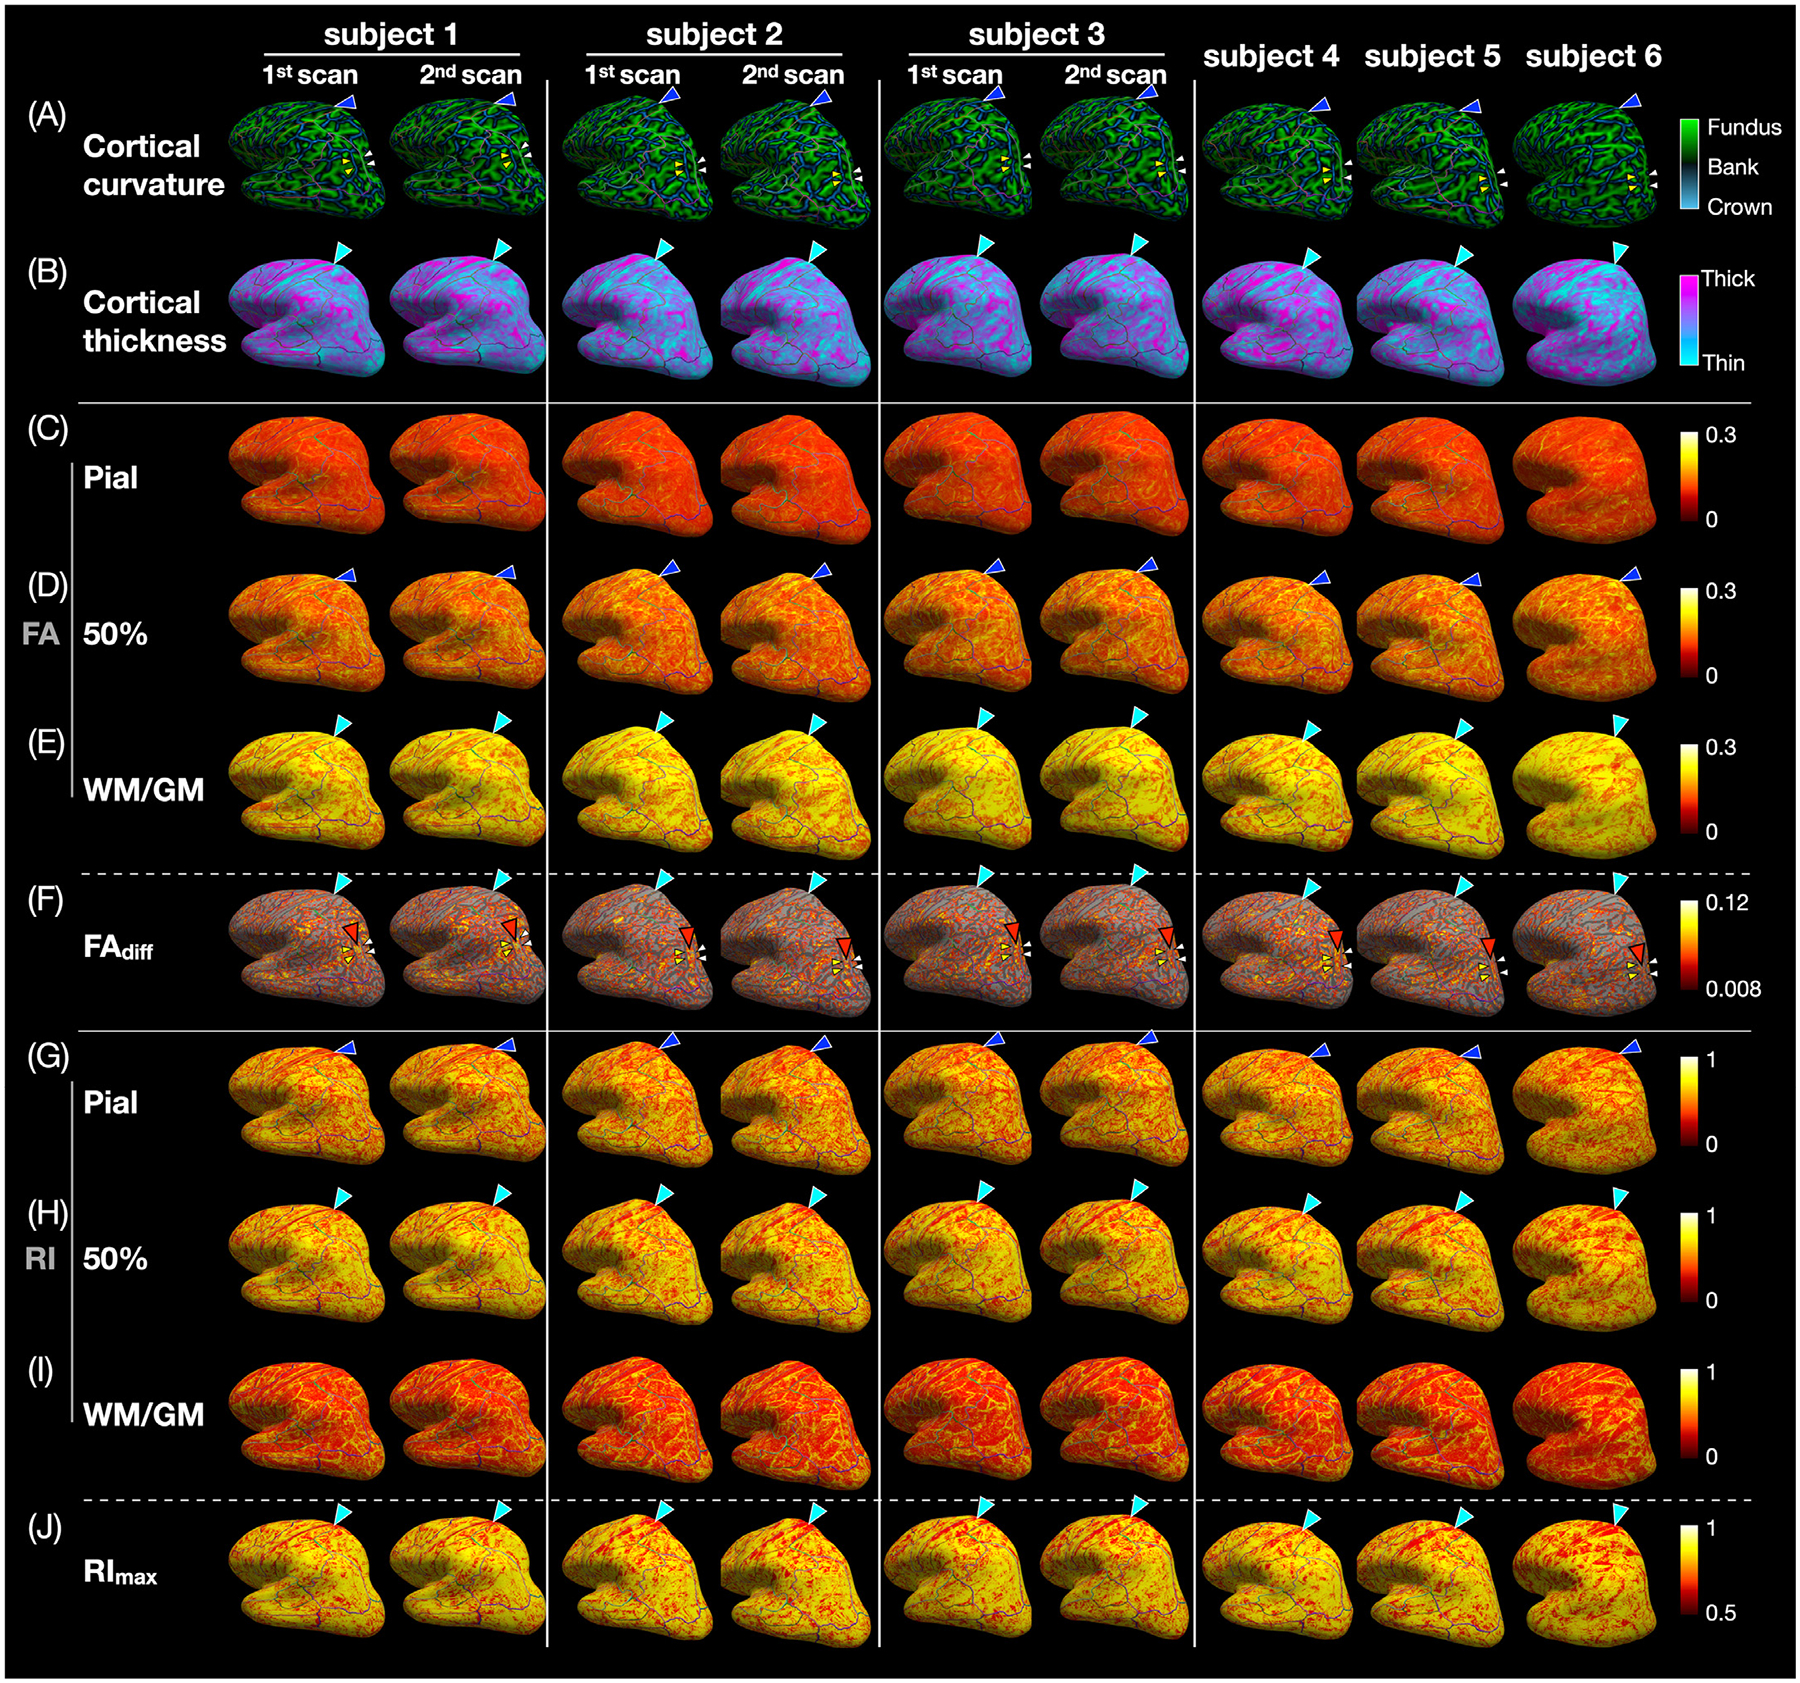
Fig. 6.

(A) Cortical curvature, (B) cortical thickness, (C-E) FA at the pial, middle, and WM/GM surfaces, (F) FAdiff, (G-I) RI at the pial, middle, and WM/GM surfaces, and (J) RImax displayed on each subject’s inflated cortical surface. In the postcentral gyrus, there is a thin band of high FA and RI at the crown (blue arrowheads) next to a wide band of high FA, low FAdiff, low RI, and low RImax where the cortical thickness is the smallest (cyan arrowheads). At the bank lateral to the intraparietal sulcus, there is a wide band of high FAdiff (red arrowheads) between two thin bands of low FAdiff at the crown (yellow arrowheads) and at the fundus (white arrowheads). In (D), the regions with FAdiff < 0.008 (i.e., with no significant FA local maximum and minimum in the FA vs. cortical depth profiles) are not color-coded and instead show the underlying inflated cortical surface, which is light gray in regions with a curvature between ± 0.15 (banks) and dark gray in regions with a curvature smaller than −0.15 (crown) or larger than 0.15 (fundus).
