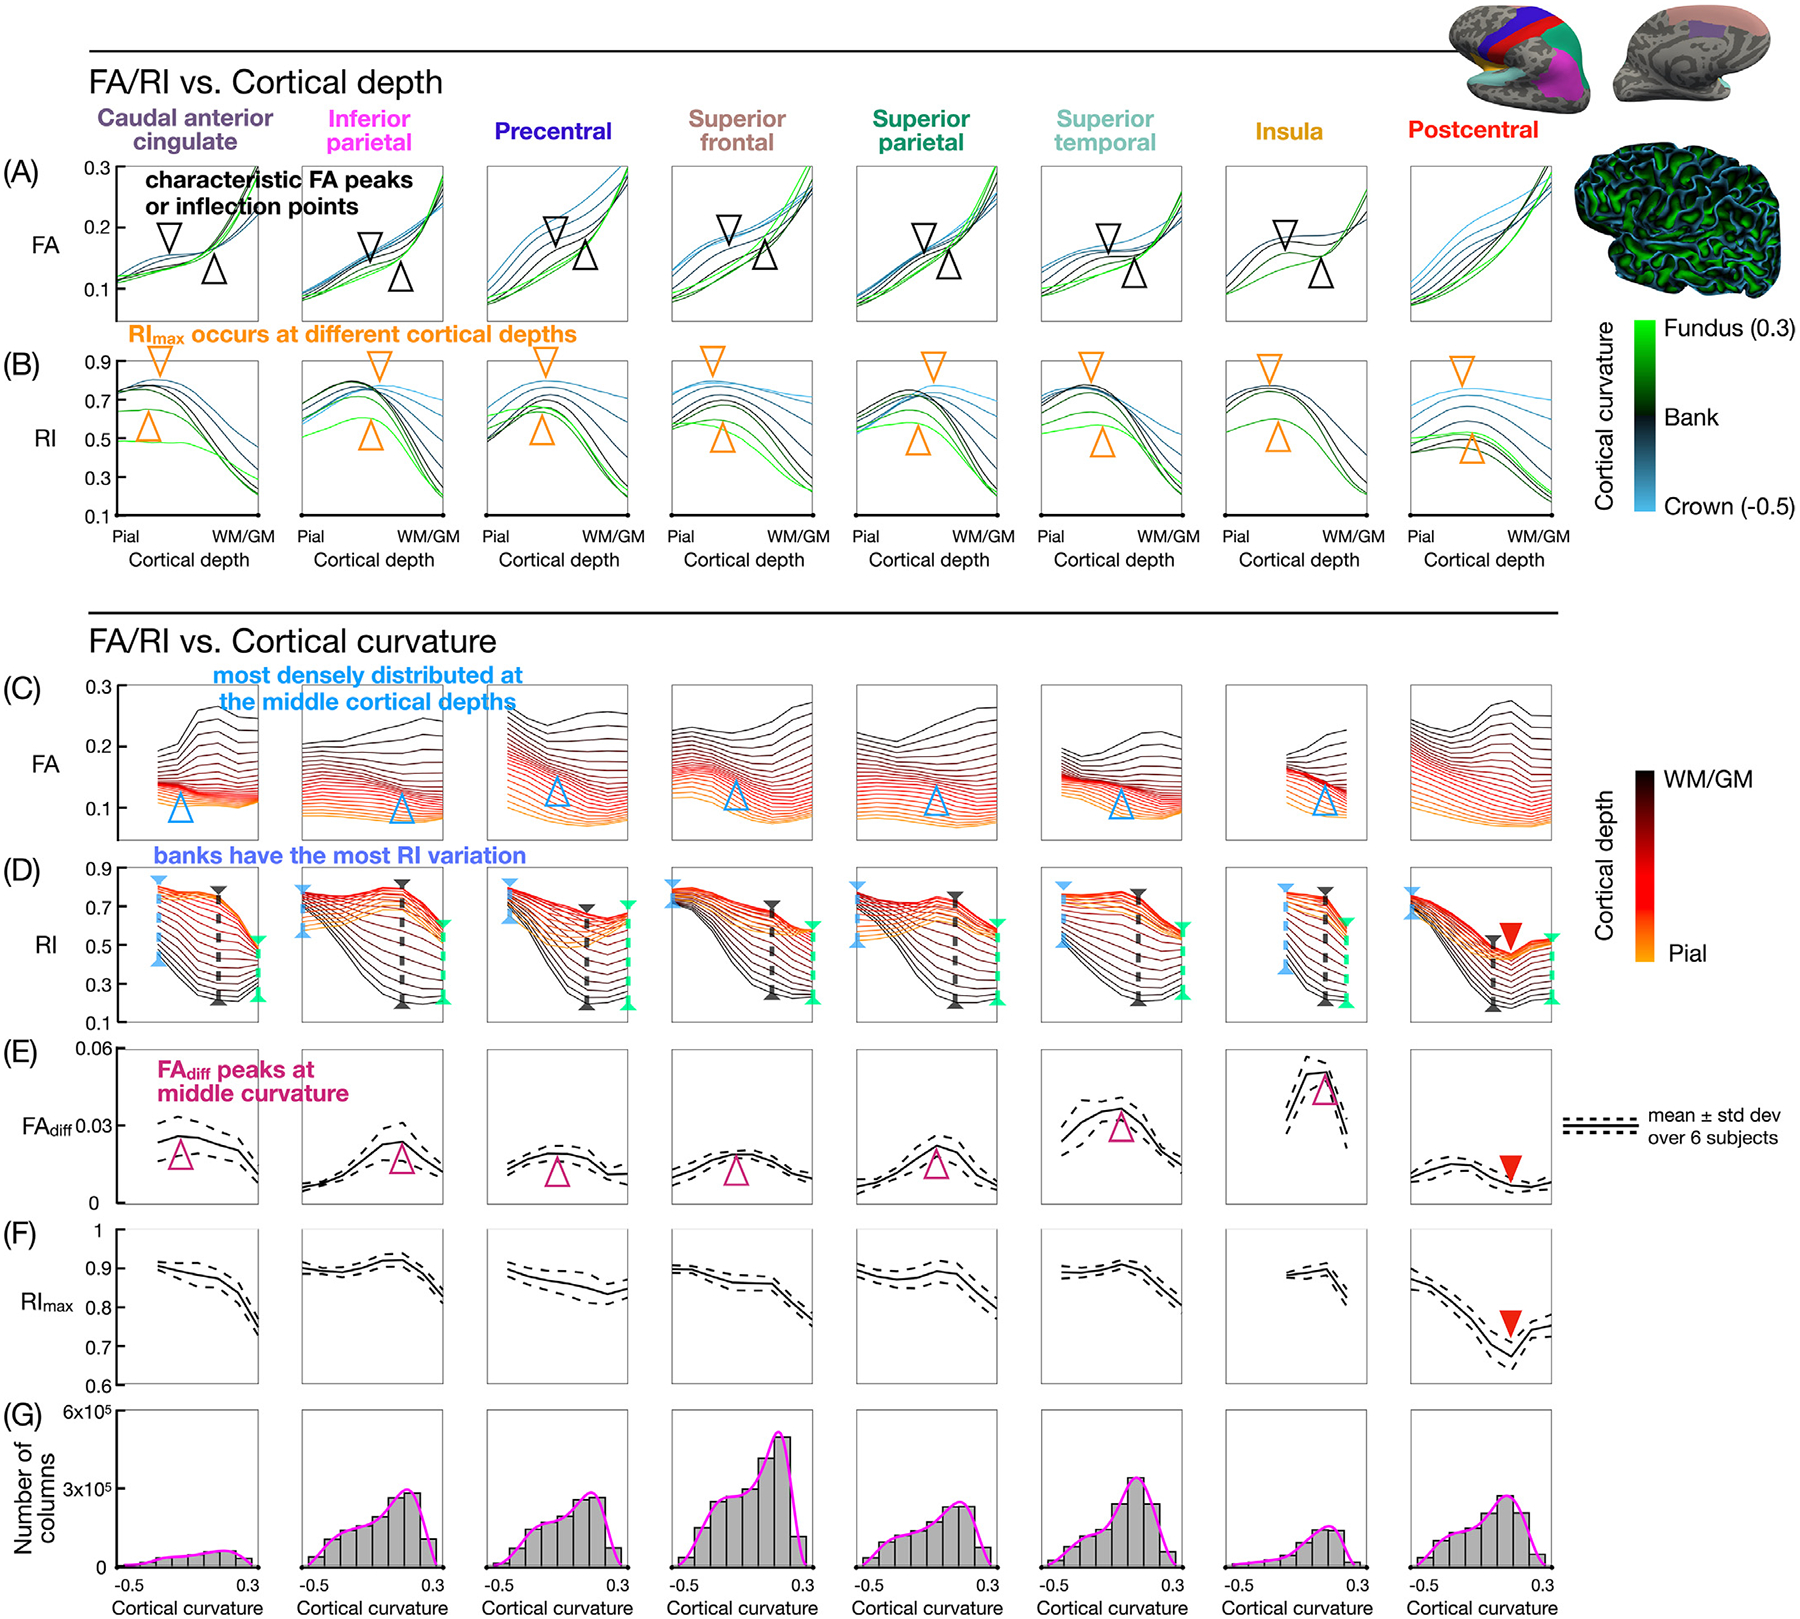
Fig. 7.

(A,B) FA and RI vs. cortical depth profiles at different curvature bins, color-coded from blue (crown) to black (banks) to green (fundus). (C,D) FA and RI vs. curvature profiles at different cortical depths, color-coded from orange (pial surface) to black (WM/GM interface). (E,F) FAdiff and RImax vs. curvature profiles. The FA local maximum and minimum (or inflection points) at the middle cortical depths and middle curvature bins (black arrowheads) correspond to the more densely distributed FA vs. curvature profiles (blue arrowheads) and to the peak in the FAdiff vs. curvature profiles (magenta arrowheads). RImax occurs at a different cortical depth and is lower in value towards the fundus (downward orange arrowheads) than towards the crown (upward orange arrowheads). The largest variation in RI along the cortical depth occurs at the banks (black dashed lines). The postcentral ROI shows lower RI, FAdiff, and RImax values (red arrowheads). (G) Histograms of the cortical curvature, with pink lines denoting the probability density function. Bins containing less than 2000 columns are excluded from the curvature-based analysis.
